1. INTRODUCTION
Telemedicine and health-care applications take advantages of the properties and usability of wireless sensor networks (WSNs), as a simple and practical technology, to collect data, transmit it to a destination, and also receive instructions to do some actions. This technology meets the aspirations of many academic and industrial researchers to collect various parameters or data in addition to medical data like environmental parameters (Nowak, 201). A special kind of WSNs used in medical applications are called wireless body sensor networks (WBSNs). The sensors, in this case, can be wearable and attached to human body (Kanna, 2011), and it is also used in other fields that require the signals of human physical activities (Yang et al., 2006; Yaqoobet al., 2013). One medical application can be monitoring, for health care, of ECG signals of a patient with cardiovascular problem during her/his stay in hospital or their convalescence period (LifeSync, 2016; Our Products, 2016). The advantage of the WBSN is its non-invasive manner of the ECG signal acquisition, which makes it easy to acquire and install. Moreover, it is painless.
The optimization and enhancement of data size transfer and delay (payload and latency) in these networks are important. In the application layer of the wireless network protocol, the data are organized into packets to be sent through the wireless link. The data rate from the network of sensors and their transmission through a wireless channel and routers until the destination (coordinator) will be a function of the wireless protocols used: The bandwidth and the network load. One of the wireless technologies adapted to the ECG application is the ZigBee and the IEEE 802.15.4 for its low data rate and low power consumption. The maximum payload length in the IEEE 802.15.4 is 118 bytes (IEEE, 2011). The rate in which symbols is sent through the PHY layer, along with the packet interarrival time (PIT), will determine the throughput of this wireless technology.
In medical applications with wireless ZigBee networks, ECG signals of the patients are transmitted for monitoring and tracking, the quality of service (QoS) of the network is an important factor since these signals are vital, especially in critical cases. The sampling rate and the accuracy of ADC conversion have a direct effect on the PIT in the application layer. This in turn will affect the throughput and end-to-end delay in the network. The main goal of this paper is to analyze the performance of WBSN deployed using ZigBee technology under maximum payload condition and different PIT using three topologies of ZigBee WSN: Star, tree, and mesh, where the nodes are distributed randomly in the same spatial area.
The remainder of this paper is organized as follows: In next section, we summarize some related works then we introduce a reminder of WBSN and ZigBee wireless protocol with a special attention is given to the packet content and length, then, the ECG signal acquisition with its sampling and quantization constraints in the application layer is introduced. Finally, some scenarios for the simulation are suggested and the simulation results are presented and commented. Then, the conclusions are given.
2. RELATED WORKS
Some published works in the area of WSN analyzed the performance of these networks regarding the QoS. In this regard, authors in Liang and Balasingham (2007) studied the performance analysis of IEEE 802.15.4 standard in terms of transmission delay, end-to-end latency, and packet delivery rate evaluated for ECG monitoring network with star topology. They show that the packet delivery rate, transmission delay, and end-to-end latency increases simultaneously with the increase of the payload size. Furthermore, the high channel efficiency causes the increase of the packet delivery rate while the payload data increasing. As most applications need large packet sizes, these applications can get them, but this will cause more latency on the network. As a conclusion, the recommendation packet sizes are 40 and 60 bytes for time-critical applications such as health-care applications. Examining the performance of different topologies of ZigBee sensor networks is the subject of the work in Kauret al. (2004). Three different topologies been used with mobile nodes: Mesh, tree, and hybrid topology. The results quantify that hybrid topology is best among other two topologies as it provides high throughput while minimum throughput is achieved in a tree topology. Golmieet al. (2004) have quantified the performance of the IEEE 802.15.4 in the presence of WiFi devices.
3. ZIGBEE, FRAME LENGTH, AND PIT
The ZigBee defines a communication layer above the PHY, MAC, and Link layer of 802.15.4. Its purpose is to create a network topology (hierarchy) to let a number of devices communicate among them and to set extra communication features such as authentication, encryption, association, and in the upper layer application services. In fact, a routing and an application and encryption layer are added. The MAC layer defines four different types of data frames that are transmitting from the upper layers to the lower layers. The IEEE 802.15.4 has a frame structure with payload size to 114 bytes, with two different types of addressing 16 bits as short addressing and 64 bits as long addressing. Thus, the payload size can reach a maximum of 114 bytes using the short addressing (IEEE, 2014). In IEEE 802.15.4, MAC and PHY use Carrier Sense Multiple Access with Collision Avoidance (CSMA/CA) to avoid nodes emitting signals at the same time.
As the MAC sublayer needs a fixed amount of time for processing, the data transferred from the PHY to the MAC layer. Each transmitted frame will be followed by a specific time known as the interframe space (IFS) period, as shown in Figure 1. The length of the IFS depends on the size of the frame that has just been transmitted. Long frames will be followed by a long IFS (LIFS) and short frames by a short IFS. In case of maximum packet size, LIFS separates the subsequence frames. From the IEEE 802.15.4 standard and it is found that one frame duration is approximately 7 ms (Burchfield et al., 2007). The PIT is the interval between two sent packets by a sensor. From Figure 1, it is clear that it cannot be <7 ms.
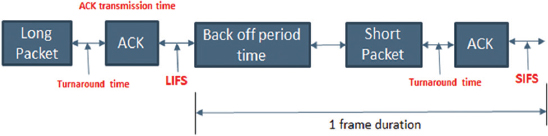
Figure 1. ZigBee frame and its interframe spaces
4. APPLICATION LAYER
A common configuration of ECG signal acquisition electrodes (sensors) is the X, Y, and Z configuration, as shown in Figure 2. In this project, we apply the ZigBee wireless protocol to transmit the ECG signals acquired from these three electrodes as on a sensor. The bandwidth of these signals is (0.05–100 Hz) (Gertsch, 2009). They can be sampled at least at 2 times this bandwidth as per the Nyquist–Shannon sampling theorem. Therefore, the heart rate sampling frequency can be chosen between 250 and 500 Hz or higher. Choosing 300 Hz as the sampling frequency is a convenient one because we can find the PIT in the application layer. The analog signal from each sensor is converted to digital using a 16 bit A/D converter. We will then calculate the number of samples that can be embedded into one packet using a sampling frequency (Fs) of 300 samples/s.
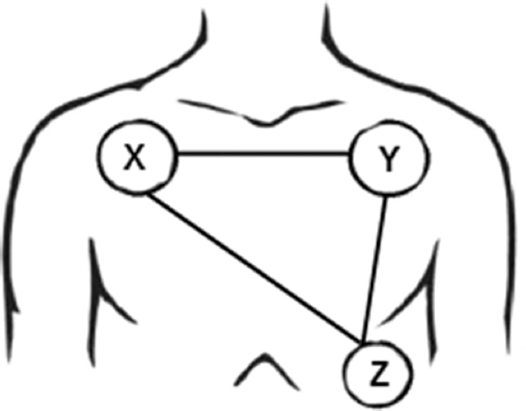
Figure 2. Three leads electrocardiogram
Using the three electrodes and the 300 Hz sampling frequency, and using a 16-bit resolution ADC converter, we will get the number of bits per sampling period. The sampling period can be found as Equation [1]:

Where, Ts is sampling time in seconds. (Note: In this work, we will assume no data compression algorithm is used).
The maximum payload size Ps in ZigBee is 114 bytes/s (912 bits/s). Therefore, the number of samples Ns that can be carried by a packet is obtained by the following Equation [2]:

Where, Ls=16 bit/sample is the number of bits per sample (accuracy of the A/D converter).
Since we have to embed three signals in a packet (X, Y, and Z), the number of samples from each signal N will be calculated by the following Equation [3]:

The duration of the signal that can be embedded in the packet is given by Equation [4]:

Figure 3 shows the width of the analog ECG signal that can be embedded into one packet.
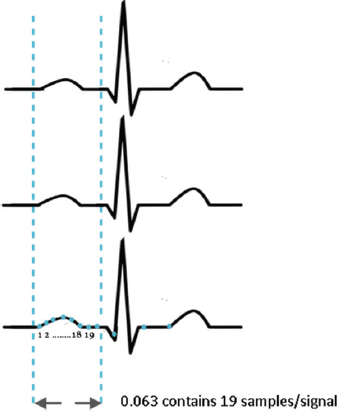
Figure 3. Electrocardiogram samples in one ZigBee Packet
Based on the bandwidth of the ECG signals, the lowest sampling frequency that can be used is 200 samples/s. This will give La of 0.095 s, but if we decrease the sampling rate, the La will increase while keeping the accuracy of 16 bit of the ADC. Hence, the maximum width of La that can be obtained is 0.095 s. Knowing that the frame length of one packet in the PHY layer is 7 ms, we can find the number of sensors to be included in the covered area (Equation [5]):

This means that 13 sensors can be included in the network. In the same way, with a 300 samples/s sampling frequency, the network can support with a correct functioning 9 sensors in the network.
5. PERFORMANCE ANALYSIS
We used the OPNET simulation tool1 for analyzing the performance of ZigBee networks for the three ZigBee topologies. Different network parameters have been simulated and analyzed. Performance indicators such as throughput, end-to-end delay, and ratio of lost packet are observed and plotted. Other network parameters are fixed as in Table 1.
Table 1: Simulation parameters
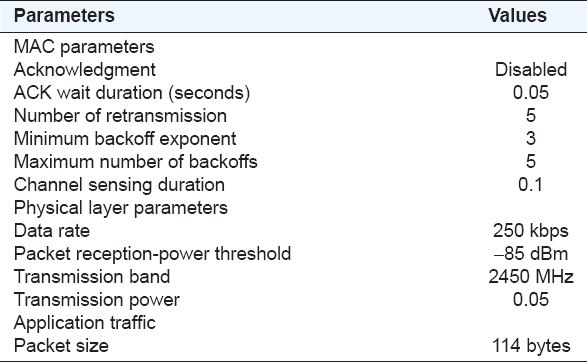
In all the scenarios, one ZigBee coordinator has been used and placed in the center of the network area and the end devices are connected directly to it in star topology or connected indirectly through routers in cluster-tree and mesh networks. The networks cover (100 m2) area and the end devices are distributed randomly in this area. Scenarios with various numbers of end nodes (8, 10, 15, and 20) have been simulated. The ACK signal has been disabled. Simulations are run to analyze the effect of the PIT on the end-to-end delay, throughput, and the lost packets.
The IEEE 802.15.4 standard is based on the CSMA/CA algorithm (IEEE, 2014), but nonetheless, a ACK transmission after reception can cause collisions. We recommend disabling the ACK in all the scenarios to obtain better performance and prevent collisions. As we will see, the lost packets are infrequent: 5 bits/s in the case of star topology and 300 samples/s. These 5 bits will not have a great effect on the quality of the ECG signal.
Three topologies are simulated for each one, and so many scenarios are run for different number of end devices (8, 10, 15, and 20). The simulation has been repeated for different values of PIT from 0.01 to 0.1. The same process is repeated for the two other topologies, i.e., cluster-tree and mesh. In the case of star topology, all the networks have a central coordinator where all the end nodes connected directly to this coordinator. In the case of cluster-tree topology, it has one central coordinator with two routers that the end nodes are randomly connected to the coordinator and the routers. Finally, in the mesh topology, one central coordinator and three routers with the random connection between the end nodes and the coordinator and routers are configured.
The simulation time was 10 min for all the scenarios, and the results of end-to-end delay, throughput, and packet sent and packet received have been collected. The Figures 4-15 show the simulation results. Throughout the simulation results, we marked the PIT related to three sampling frequencies to distinguish the range of real operating values. The lowest sampling frequency allowed for 200 samples/s.
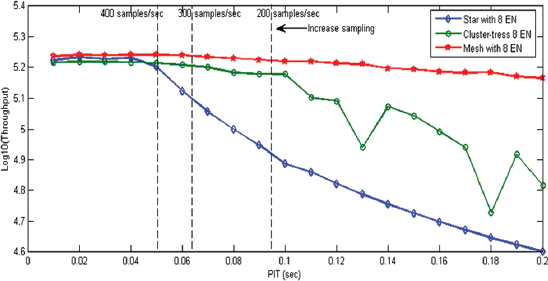
Figure 4. Throughput of 8 end nodes networks
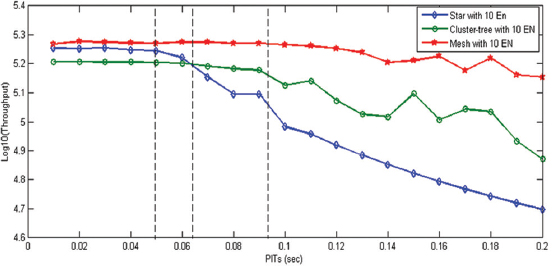
Figure 5. Throughput of 10 end nodes networks
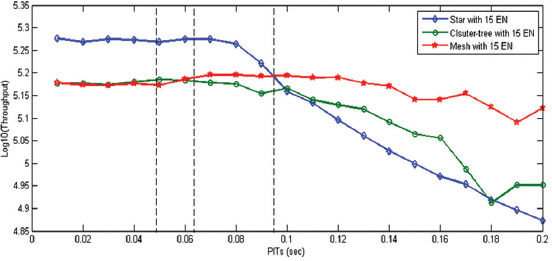
Figure 6. Throughput of 15 end nodes networks
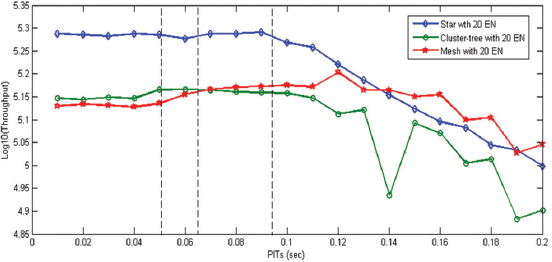
Figure 7. Throughput of 20 end nodes networks
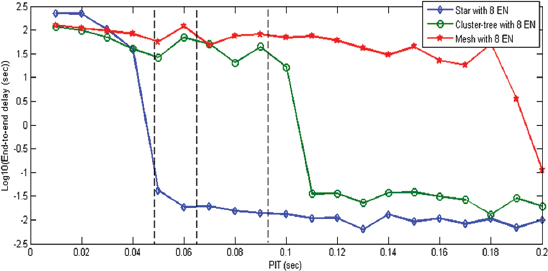
Figure 8. End-to-end delay of 8 end nodes networks
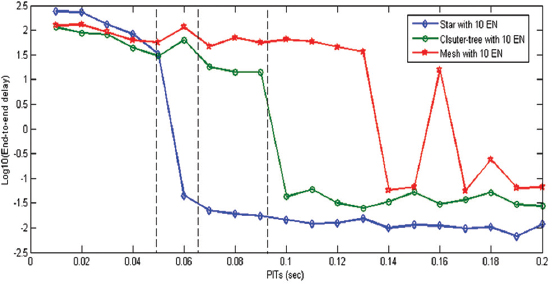
Figure 9. End-to-end delay of 10 end nodes networks
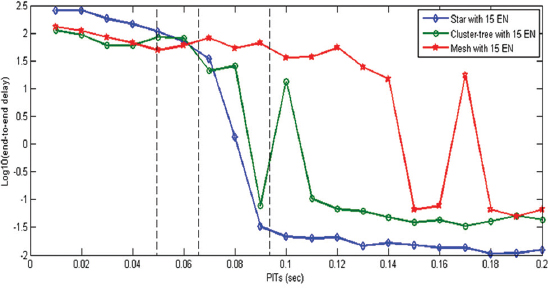
Figure 10. End-to-end delay of 15 end nodes networks
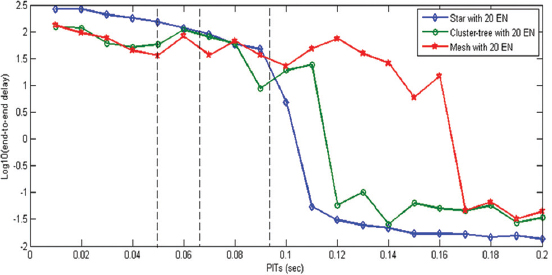
Figure 11. End-to-end delay of 20 end nodes networks
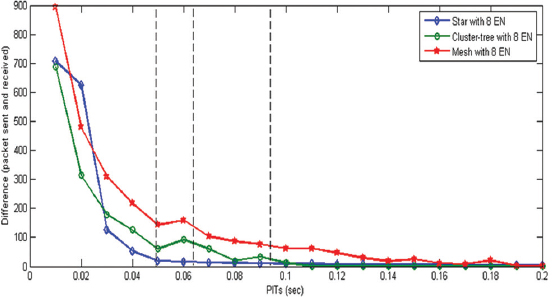
Figure 12. Lost packets of 8 end nodes networks
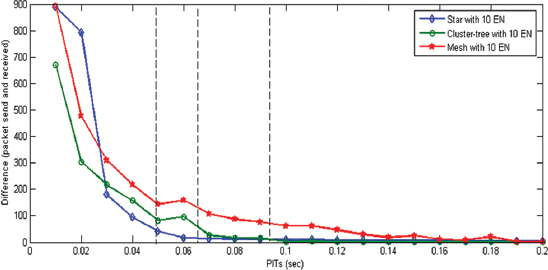
Figure 13. Lost packets of 10 end nodes networks
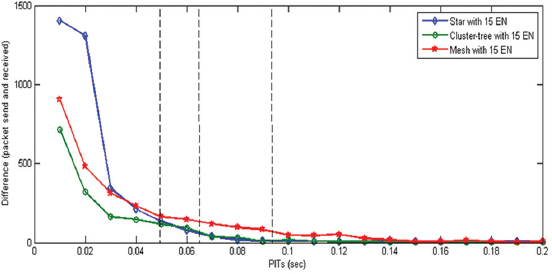
Figure 14. Lost packets of 15 end nodes networks
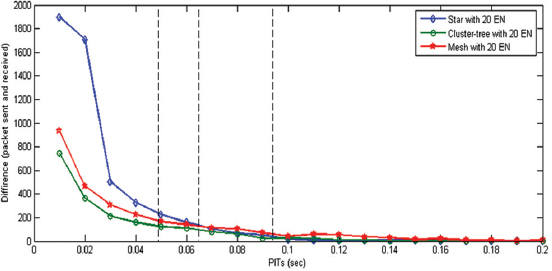
Figure 15. Lost packets of 20 end nodes networks
1. Throughput is defined as the total number of bits forwarded from 802.15.4 to the upper layers in all the network nodes. The results are shown in Figures 4-7. We can see that the mesh networks have higher throughput with small size networks (8 and 10 end nodes) and their throughput stay high with little decrease comparing with the star and cluster-tree networks. The fact that throughput remains high with higher interarrival time explains that collisions are more frequent.
While in larger networks (15 and 20 end nodes), the throughput of star networks is higher until it reaches a high PIT, then, the throughput started to decrease because less data are sent.
Throughout the figures, we can conclude that the mesh has a lower performance in terms of useful throughput.
2. End-to-end delay: End-to-end delay that can be defined as the time between the packet generation by the end devices and packet received by the network coordinator. The results of the end-to-end delay show that star network with different sizes (8, 10, 15, and 20 end nodes) show the minimum end-to-end delay in comparison with the other topologies. Although it has high delay with small PIT with increases in PITs, the end-to-end delays start to decrease because the network is less loaded as shown in Figures 8-11.
In cluster-tree and mesh networks, the end-to-end delay also decreases when the PIT increases. From Figures 10 and 11, we conclude that the star network is the best network topology for critical application where time is critical.
3. Packet sent and packet received: By analyzing, the packet sent and received from the end nodes to the coordinators, the results in Figures 12-15 show that in all the networks with small PIT, a large number of packets were lost while sending from the end nodes to the coordinators.
However, when the PITs increase, the lost file decreases.
6. CONCLUSION
The WBSNs using portable and light weight sensors with ZigBee IEEE 802.15.4 wireless protocols are suitable for medical applications such as collecting, monitoring, and tracking ECG signals from patients inside a medical structure. A fixed coordinator node forming a star network topology has the best performance in terms of throughput, end-to-end delay, and low packet loss rate. The results show that within the extent of ZigBee coverage area (70–100 m), the star topology has better performance in addition to its simpler network deployment. The simulations were done with maximum packet length (912 bits) and different PIT periods that can be controlled in the application layer. The lower the PIT value, the higher a sampling rate of the ECG signal can be allowed, and this is for a fixed A\D conversion accuracy. The range of nominal operation in the application layer has been determined for a fixed A\D accuracy (16 bits). In this work, we assumed a raw ECG data transmission without any compression algorithm and no other overhead information such as node ID and GPS position which are useful in practical applications.