1. INTRODUCTION
Iraq is a major oil producer from oilfields that are mostly located in the Zagros Mesopotamian Cretaceous and Tertiary system. Khabbaz oilfield is known as one of Iraq’s massive oilfields, it has many pay zones, and they are producing from the Tertiary and Cretaceous reservoirs which major reservoir system consists of the middle Lower Cretaceous Qamchuqa Group.
In 1955, the first seismic survey of the Khabbaz oilfield was conducted by the Iraqi Petroleum Company. In 1971, the second seismic investigation of the Khabbaz area started and it revealed the structure of the field. Based on these seismic surveys, the first oil well was drilled in 1976.
The Qamchuqa Limestone Formation was first defined by Bellen et al. (1959) at the Qamchuqa Gorge in NE Iraq. It composed of thick-bedded limestone, and it is often strongly dolomitized (Jassim and Goff, 2006). At its type section, this formation locates conformably on the gray marlstones of the Sarmord Formation and is unconformably overlain by the limestones of the Kometan Formation. Qamchuqa formation in the Khabbaz oilfield is composed of massive limestone with partially dolomitized limestone, rich of the following fossil assemblages: Foraminifera, corals, algae, bivalves, and rudists in addition to lagoonal foraminifera and stromatolites (Al-Qayim et al., 2010). The dolomitized units are composed of massive, coarsely crystalline dolomite.
Al-Peryadi (2002) conducted a study in the Bai Hassan oilfields on Jwan formation and Upper Qamchuqa Formation to determine the effective porosity and sedimentology of those formations. He divided the Upper Qamchuqa Formation into four reservoir units and added to that Dokan Formation is separated unconformably with upper part of Qamchuqa Formation based on the gamma ray log data. Moreover, the boundary of this formation with the underlying Upper Sarmord Formation is identified.
Ameen (2008) studied the lithostratigraphy and sedimentology of Upper Qamchuqa Formation in northeastern Iraq. Based on fossil content and lithology of Upper Qamchuqa Formation, he divided this formation into eight units, and also recommended the contacts of Upper Qamchuqa boundaries to be Dukan formation in the upper part and Sarmord Formation in the lower part of Upper Qamchuqa Formation.
Qadir (2008) conducted a study to evaluate the formation of the Upper Qamchuqa reservoir in the Khabbaz oil field. In this research, 10 wells in the Khabbaz oil field were selected. He used core plugs with the help of wireline logging including; porosity, gamma ray logs, and resistivity logs, so that he could measure permeability, porosity, and resistivity. As a result, he subdivided the Upper Qamchuqa reservoir into three lithological units A, B, and C where dolomitization effects on most of the part of the reservoir rock. The results show out of three lithological units, Unit A has the best reservoir characteristics.
Rasheed (2008) investigated the Cretaceous Upper Qamchuqa Formation in the TaqTaq Oil Field, to analyze the reservoir characterizations of that formation. He studied four wells so as to have the best section of the Upper Qamchuqa Formation. Accordingly, by studying different types of well logs such as gamma ray, sonic log, resistivity log, density log, spontaneous potential log (SP), neutron log, and image log (EMI) and using plug and core analysis, he could evaluate porosity, permeability, evaluate residual oil, movable oil, movable water, and residual water. He also determined effective porosity, analyzing the fracture impact on the development of the reservoir rocks, and estimated the impact of digenesis and microfacies on the development. Based on overall results, he divided the Upper Qamchuqa reservoir into three lithological units with four porosity units.
Al-Qayim et al. (2010) conducted a study on the Upper Qamchuqa Formation of the Khabbaz oilfield to evaluate porosity and dolomitization of that area. Based on studies of wireline logs, cores, and cutting samples of 10 wells, they subdivided the Upper Qamchuqa Formation layers into units such as Unit A, B, and C, and they showed Unit A to be the main reservoir, and Units B and C as lower quality reservoir units.
1.1. Study Area
The Khabbaz oilfield has a small asymmetrical subsurface anticline with a length of about 20 km and a width of about 4 km. It is dip in the southwest limb is higher than in the northeast. It is located between BaiHasan and Jambor fields, northwest of the Kirkuk area [Figures 1 and 2]. This oilfield is located in the foothill of the Zagros fold-thrust belt.
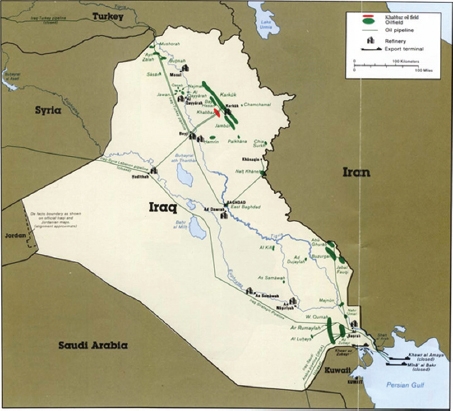
Figure 1. Iraq’s map showing the location of the Khabbaz oil field in red color (worldofmaps.net)
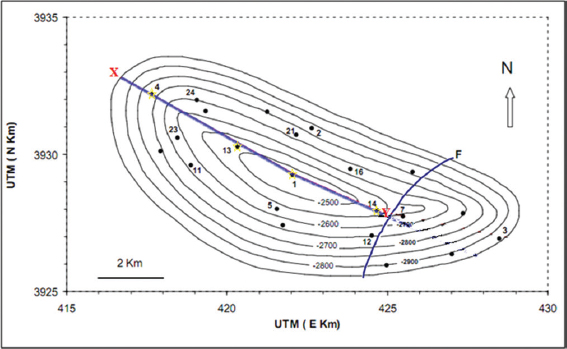
Figure 2. The structural contour map of Qamchuqa reservoir in the Khabbaz oil field (N. O. C. 1982)
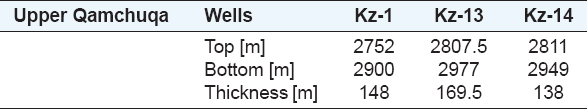
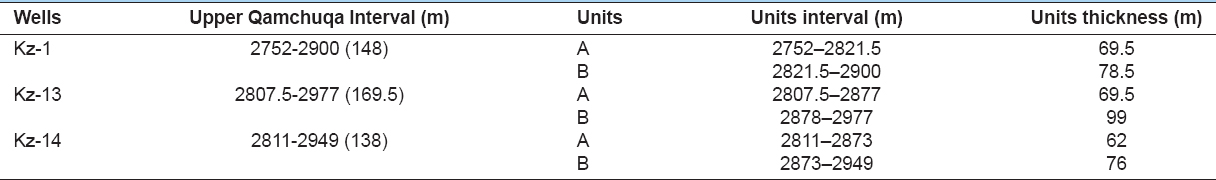
Since drilling the first well in the Khabbaz oilfield in 1976, nearly, 30 wells have been drilled. Most of the drilled wells reached the Upper Qamchuqa Formation, and a few wells penetrated the Lower Qamchuqa Formation. The Upper Qamchuqa also known as Mauddud Formation (Buday, 1980) is a very shallow to shallow carbonate shelf, and it is Lower Cretaceous deposits, extend over the Arabian Basin. The thickness of the three studied wells in Upper Qamchuqa reservoir ranges from 138 to 170 m [Table 1].
Table 1: Thickness of studied wells in the Upper Qamchuqa from top to bottom
The main aim of this research is to identify the petrophysical parameters and the lithological characteristics of three Khabbaz oil wells, to evaluate the quality of the Upper Qamchuqa Formation through correction and interpretation of log data, the following aspects could be evaluated:
-
• Determination of lithology and thickness for each units
-
• Shale volume
-
• Correlation between the wells
-
• Estimation of porosity and variation of porosity with depth
-
• Oil saturation and water saturation
-
• Identification of hydrocarbon pay zones.
2. METHODOLOGY
To study selected wells in the Khabbaz oilfield for achieving several petrophysical parameters, the summary of the methods in this study can be summarized as follows:
-
a. Wireline logs for the three wells were used including gamma ray log, sonic log, neutron log, density log, and resistivity logs such as Rxo and Rt logs.
-
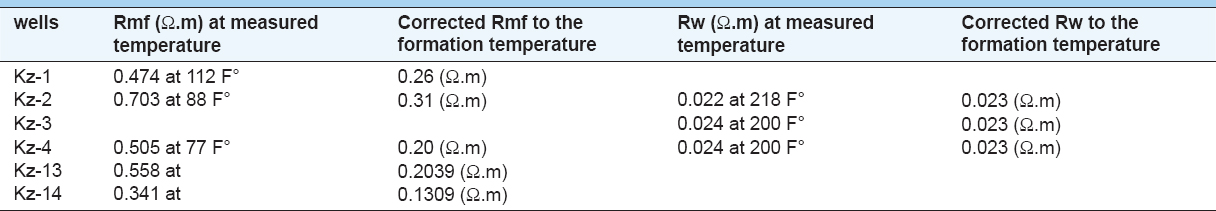
b. Water formation analyzing data includes many geochemical analyses of the Upper Qamchuqa reservoir, which were obtained from the North Oil Company. In this study, formation water resistivity (Rw) has been used [Table 2].
Table 2: Rmf and Rw corrections into formation temperature (Petroleum Engineering Department, N. O. C. 1976-1982)
-
c. “Getdata222” software is used to digitize the logs and save the data into raw log data which enabled us to measure the petrophysical properties of the Upper Qamchuqa reservoir such as lithology, shale volume, and porosity.
3. RESULTS
3.1. Well Correlation
Based on variations of porosity and lithology of the Upper Qamchuqa reservoir, Upper Qamchuqa has been divided into two parts, Units A and B. As a result, based on both units A and B, the correlation between three Khabbaz wells has been achieved. Figure 3 shows the correlation between Kz-1, Kz-13, and Kz14.
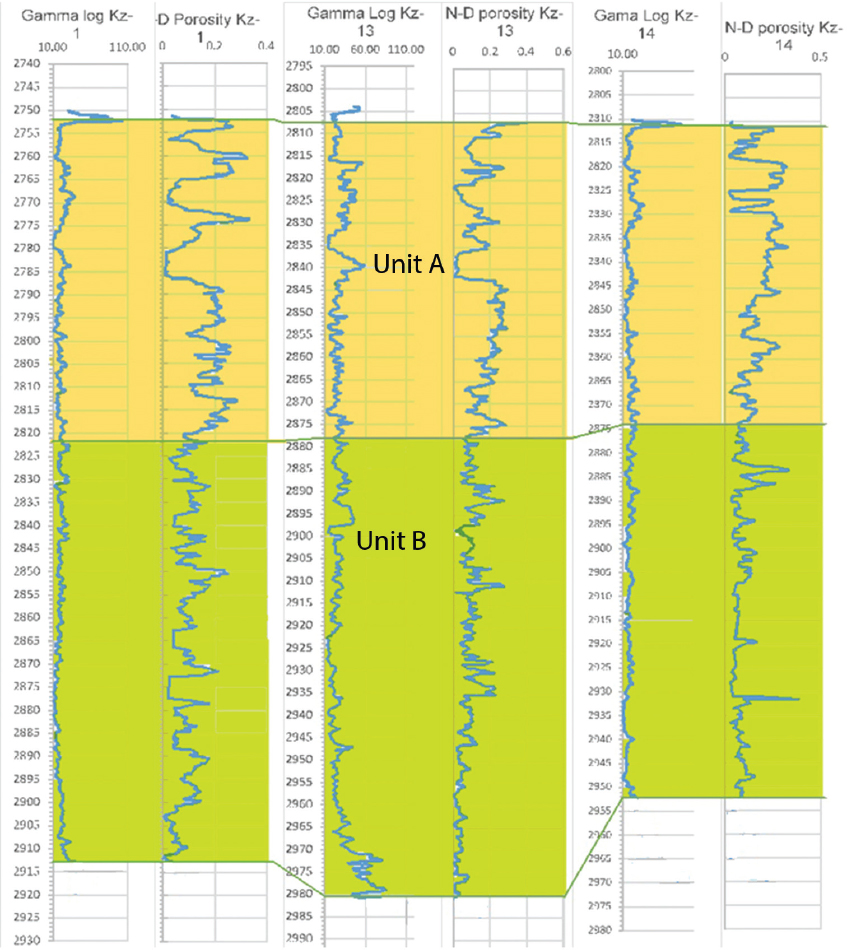
Figure 3. The correlation of gamma and N-D porosity response against the lithologic units of Upper Qamchuqa Formation in wells Kz-1, Kz-13, and Kz-14
3.2. Shale Volume
Since the reservoir sections of all wells have almost minimum GR log value, it seems that the reservoir section nearly has a clean formation. Numerically, shale volume (Vsh) has been found for the wells using the following equation, and it shows that shale volume increases with depth [Figure 4]. Table 3 summarizes the average shale volume of three wells.
Table 3: Quantitative calculations of average shale volume for the Khabbaz oil wells
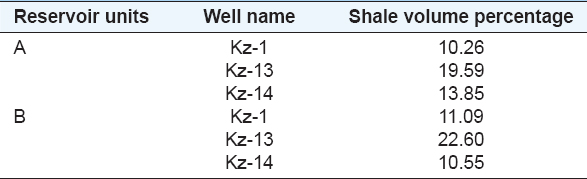
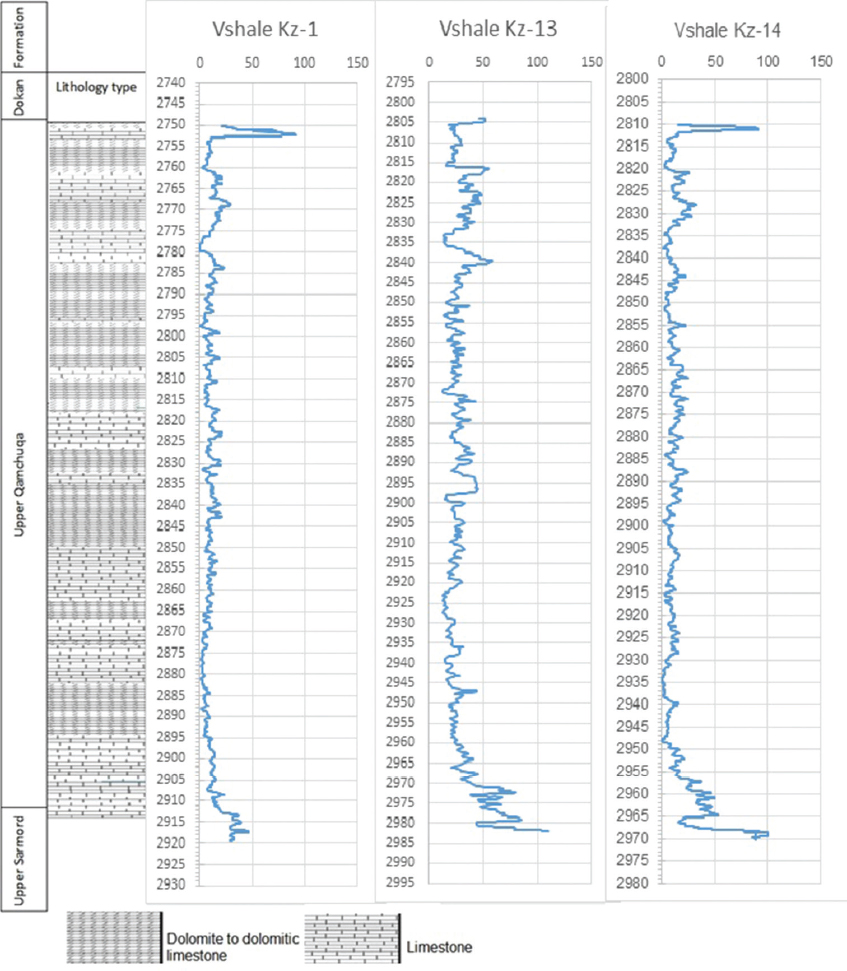
Figure 4. Percentage of shale volume of three wells Kz-1, Kz-13, and Kz-14 of the Upper Qamchuqa reservoir
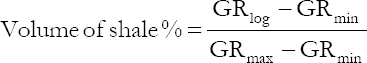
Where
GRlog is gamma ray reading from different depth.
GRmin is minimum gamma ray.
GRmax is maximum gamma ray.
Sometimes, the value of Vshalepercentage is called the gamma ray index (IGR) (Rider and Kennedy, 2011).
3.3. Lithologic Units
The Upper Qamchuqa Formation is characterized by having variable porosity and lithologic units. The lithology of the reservoir has been determined by a Neutron-Density (N-D) combination which shows that the lithology of the formation mostly consists of limestone and dolomite to dolomitic limestone [Figure 5]. For easier interpretation, Khabbaz wells are divided into two units, top and bottom, named A and B [Figure 3]. The range of their intervals and thicknesses is shown in Table 4.
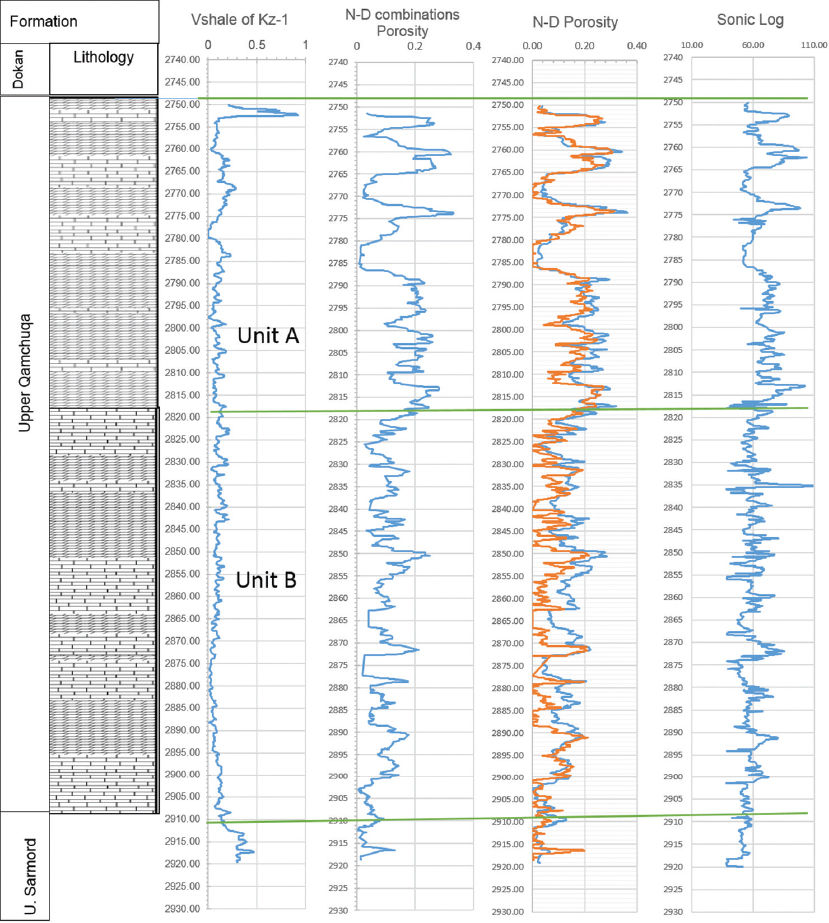
Figure 5. Well Kz-1 showing the response of Neutron-Density combination, sonic log with the shale volume in blue as well as neutron porosity in blue and density porosity in red of the Upper Qamchuqa Formation, in the Khabbaz oilfield
Table 4: Intervals and thicknesses of Units A and B for the wells of Kz 1, Kz 13, and Kz 14
3.4. Porosity unit Calculations
The porosity of the three wells of Upper Qamchuqa Formation in Khabbaz oilfield has been obtained from the N-D combination and sonic log. Figure 6 shows a good match between sonic porosity and N-D combination porosity observing that N-D porosity is greater than sonic porosity and this difference is due to N-D logs recording total porosity (primary and secondary porosity), while the sonic log responds to intergranular (primary porosity). Figure 6 also shows porosity decreases with depth due to the overburden pressure. Based on N-D combination porosity and sonic porosity, it has been calculated that the porosity in this reservoir is ranging between 10% and 25% [Tables 5 and 6]. The reservoir sections are divided into Units A and B as described on the following page.
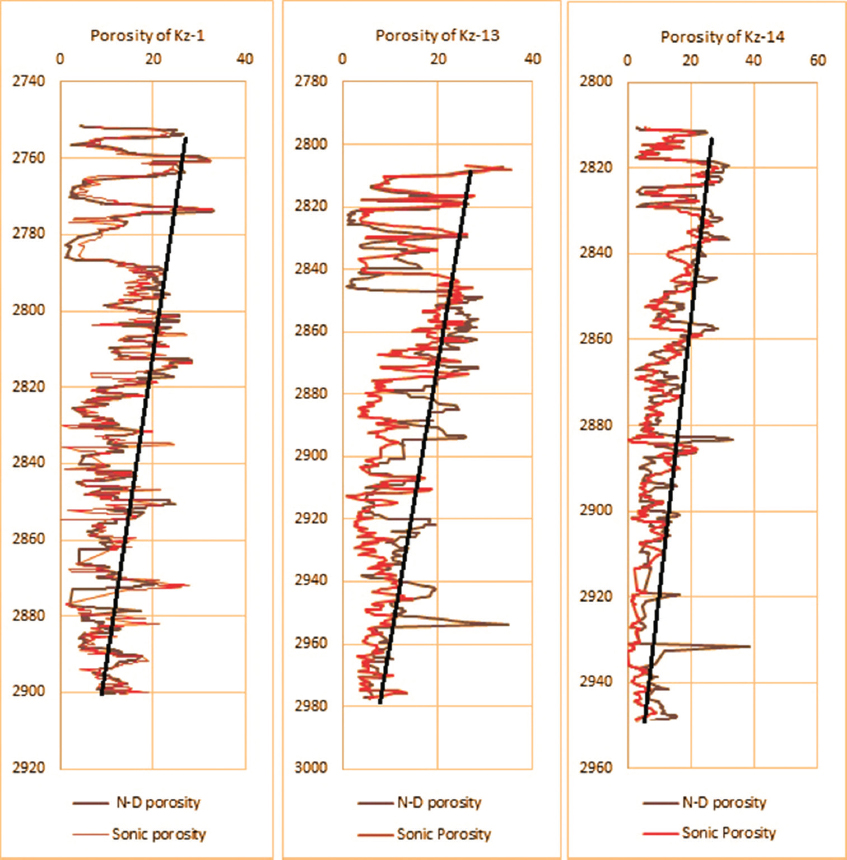
Figure 6. Shows the difference between porosity derived from N-D combinations and sonic logs
Table 5. Computed petrophysical parameters of Unit A for Kz-1, Kz-13, and Kz-14 wells
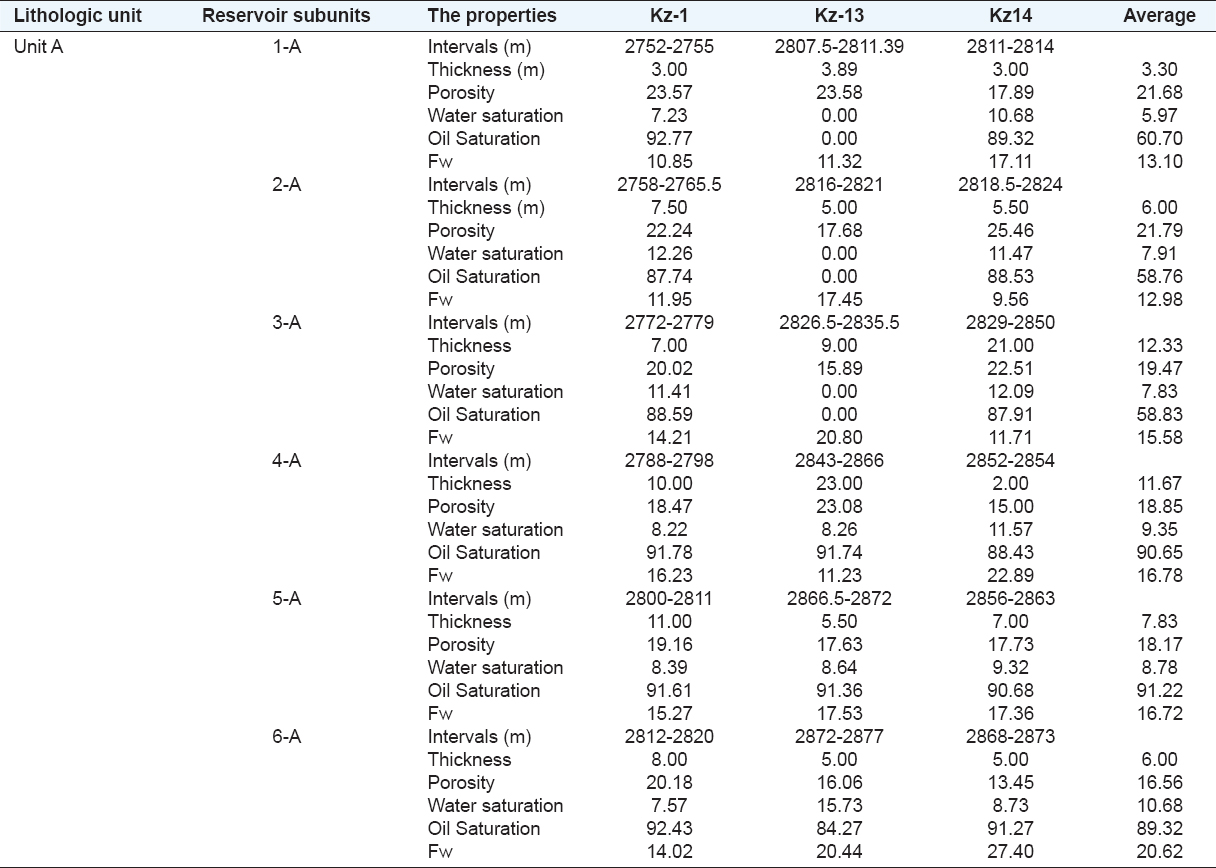
Table 6. Computed Petrophysical parameters of Unit B for wells Kz-1, Kz-13 and Kz-14
3.5. Unit A
Unit A is the upper part of the Khabbaz oilfield, and its thickness ranges from 62 to 69.5 [Table 5]. Based on N-D combination porosity and sonic porosity, it was revealed that Unit A represents the most important reservoir in the Khabbaz oilfield and it has been characterized by having high porosity. Unit A reservoir has been subdivided into six reservoir subunits, namely, 1-A, 2-A, 3-A, 4-A, 5-A, and 6-A based on N-D porosity. All six reservoir subunits are separated by five non-reservoir units, namely, 1-N, 2-N, 3-N, 4-N, and 5-N [Figure 7]. The reservoir fluid of each subunit has been found and compared with porosity [Table 5 and Figure 8]. From the N-D cross plot, ranges of porosity and lithology were identified as shown in Figures 9-11, based on the points that fall between limestone and dolomite suggesting that the lithology of this unit is dolomitic limestone.
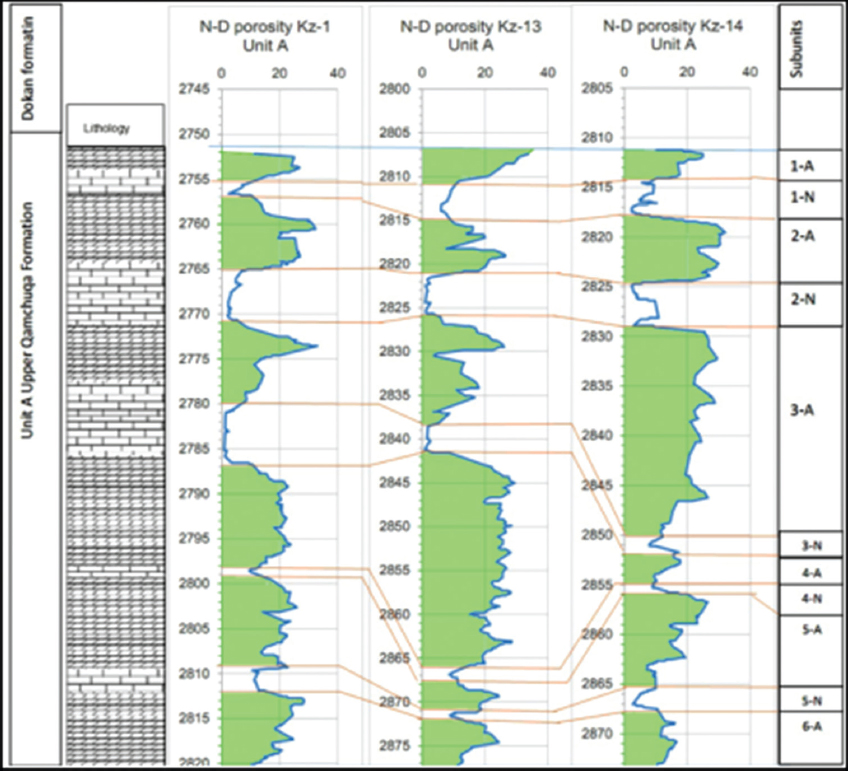
Figure 7. Unit A shows the various reservoir and non-reservoir subunits in Kz-1, Kz-13, and Kz-14 wells
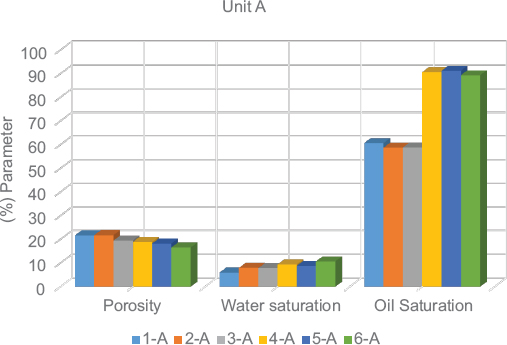
Figure 8. Diagram shows the relationship between average porosity, water saturation (SW), and oil saturation (SO) in all reservoir subunits of Unit A in the Kz-1, Kz-13, and Kz-14 wells
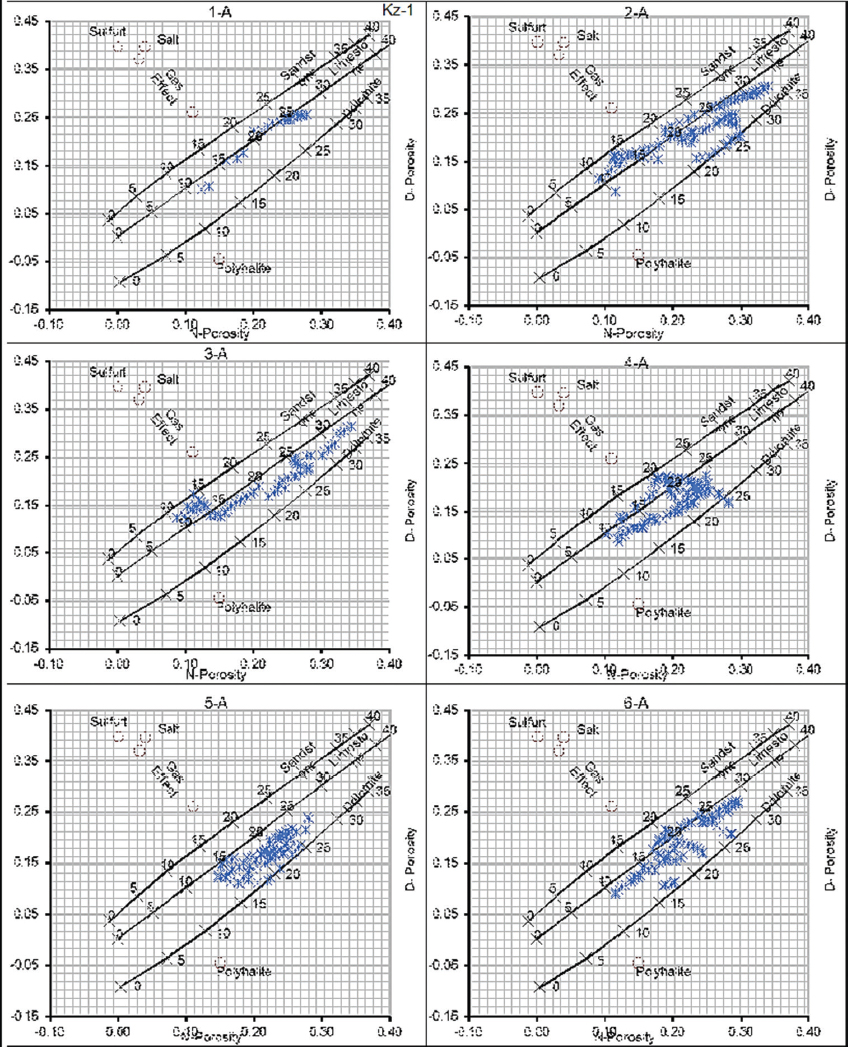
Figure 9. N-D cross plot of Kz-1 for Unit A. Subunit 1-A is limestone with porosity of about 15-25%. Subunit 2-A is mostly limestone to dolomitic limestone with porosity of about 10–30%. 3-A is limestone to dolomitic limestone with porosity of about 10–30%. Subunit 4-A is dolomitic limestone with porosity of about 10–25%. Subunit 5-A is mostly dolomitic limestone with porosity of about 15–25%. Subunit 6-A is dolomitic limestone with porosity of about 10–30%
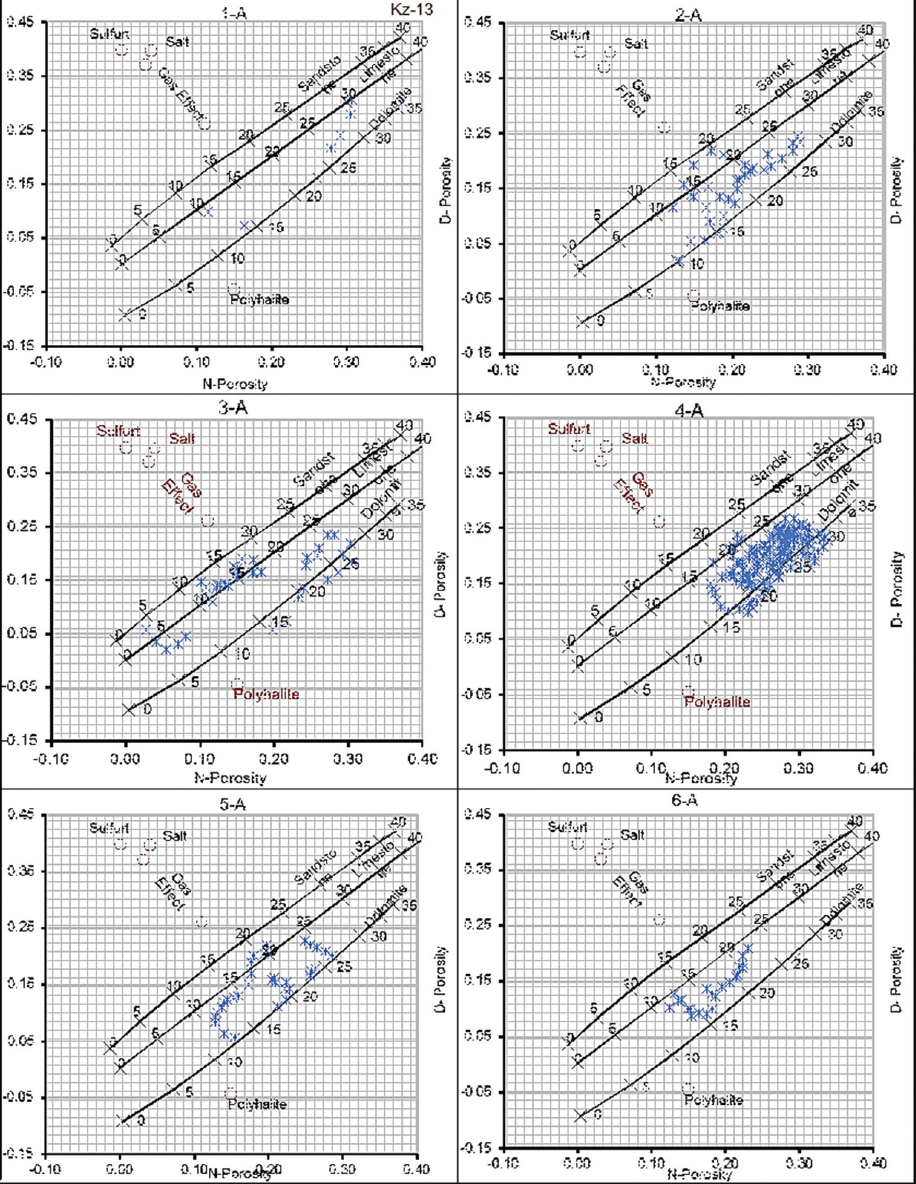
Figure 10. N-D cross plot of Kz-13 for Unit A. 1-A is dolomitic limestone with porosity of 10-30%. Subunit 2-A is limestone to dolomitic limestone with porosity of 15–27%. Subunit 3-A is limestone to dolomitic limestone with porosity of 10–25%. Subunit 4-A is dolomite to dolomitic limestone with porosity of 15–30%. Subunit 5-A is dolomitic limestone with porosity of 10–25%. Subunit 6-A is dolomitic limestone with porosity of 15–20%
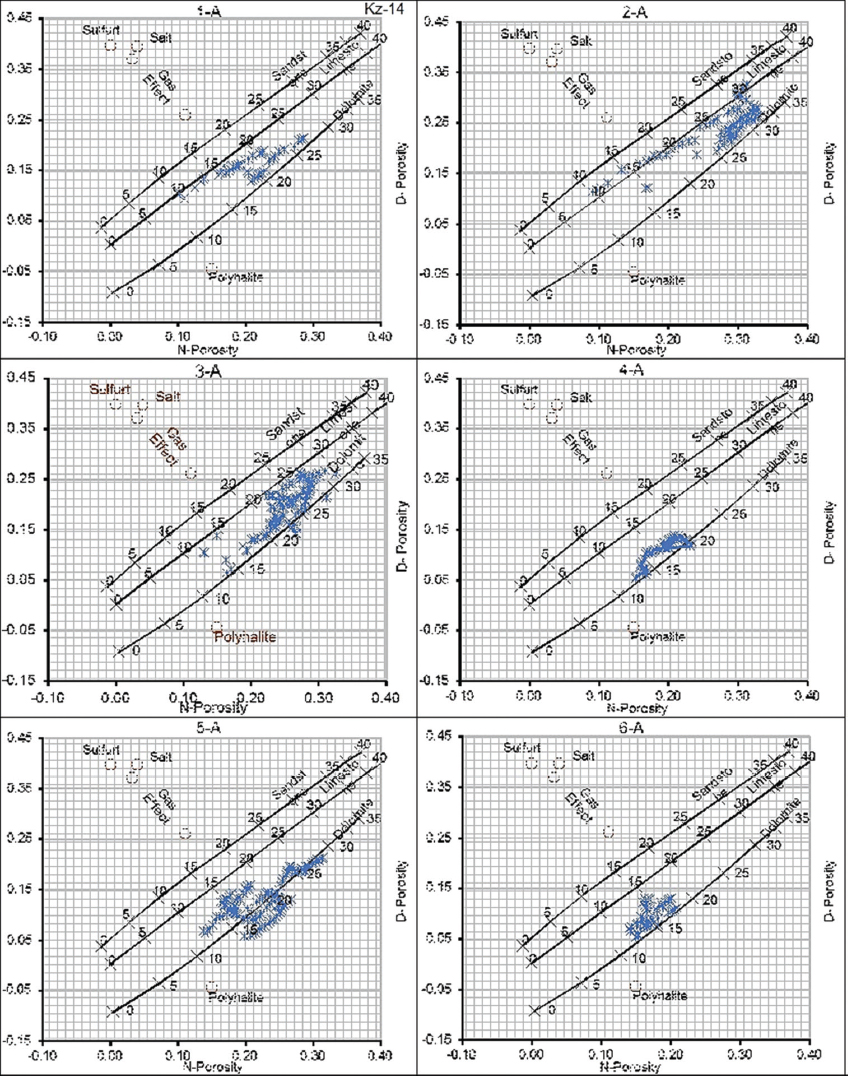
Figure 11. N-D cross plot of Kz-14 for Unit A. Subunit 1-A is dolomitic limestone with porosity of 10%-25%. Subunit 2-A is limestone to dolomitic limestone with porosity of 10–30%. Subunit 3-A is dolomite to dolomitic limestone with porosity of 15–30%. Subunit 4-A is dolomite with porosity of 15–20%. Subunit 5-A is dolomite with porosity of 10–25%. Subunit 6-A is dolomite to dolomitic limestone with porosity of 10–15%
3.6. Reservoir Subunit 1-A
It is located under Dukan formation [Figure 7], it represents the upper part of Upper Qamchuqa reservoir, with thickness of 3 m in Kz-1 and Kz-14 and 3.89 m in Kz-13 [Table 5]. This unit is characterized by having good porosity ranging from 17.88% to 23.58% with an average porosity of 22%. N-D diagrams [Figures 9-11] of Kz-1, Kz-13, and Kz-14 show that most of the points are laying between limestone and dolomite which they suggested that the lithology of subunit 1-A is dolomitic limestone wherein Kz-1 the points are falling on limestone curve. Reservoir fluid studies show that subunit 1-A has water formation of 10.85, 11.32, and 17.11 for wells Kz-1, Kz-13, and Kz-14, respectively, water saturation of 7.22–10.68 and oil saturation of 89.3–92.7% for Kz-1 and Kz-14 [Table 5], while the Sw and So for Kz-13 are not available since the resistivity log in this interval has not been run.
3.7. Reservoir Subunit 2-A
This reservoir is located below subunit 1-A [Figure 7] and it is separated from 1-A by a non-reservoir layer called 1-N. The thickness of subunit 2-A is ranges between 5 and 7.5 m. N-D combination of this subunit [Figures 9-11] shows that the lithology of this unit is limestone to dolomitic limestone. This unit has a very useful porosity ranging from 17% to 25%. The water saturation of Kz-1 and Kz-14 is 12.25 and 11.46, respectively, and oil saturation for both wells is 87.7 and 88.5, respectively [Table 5], while for Kz-13 the data are not available since the log has not been run in this interval.
3.8. Reservoir Subunit 3-A
Subunit 3-A is underlined with reservoir subunit 2-A by non-reservoir 2-N, and it has an average thickness in Kz-14 of 21 m and it is decreasing in Kz-1 to about 7 m [Figure 7]. The N-D cross plot shows that the subunit reservoir 3-A lithology is mostly dolomite, dolomitic limestone to limestone [Figures 9-11]. The porosity of subunit 3-A ranges between 16% and 25.5% [Table 5]. The average water saturation for Kz-1 and Kz-14 is 11% and 12% and oil saturation is 88.6–88%, respectively [Table 5], while for Kz-13 the log has not been run at this depth.
3.9. Reservoir Subunit 4-A
It is below reservoir subunit 3-A underlying by non-reservoir unit named 3-N. This subunit has an average thickness more than 10 m except in Kz-14. The N-D cross plot shows that this subunit reservoir is mostly dolomite to dolomitic limestone lithology [Figures 9-11]. The porosity of this subunit is ranging from 15% to 23% [Table 5], and the average water saturation, oil saturation, and water formation of this subunit are 9.35%, 90.64%, and 16.78%, respectively [Figure 8].
3.10. Reservoir Subunit 5-A
This subunit is underline with subunit 6-A, it separated with subunit 6-A by a non-reservoir 5-N. This subunit reservoir has a greater thickness in Kz-1 and it gets thinner in Kz-14. The N-D diagram shows that this reservoir subunit is mostly dolomite lithology [Figures 9-11], and it has porosity ranging from 17% to 19%. The average water saturation, oil saturation, and water formation of this subunit are 8.7%, 91.2%, and 16.7%, respectively [Figure 8].
3.11. Reservoir Subunit 6-A
Subunit 6-A is the last part of reservoir Unit A, and its average thickness is about 5 m except in Kz-1 which is 8 m. It is porosity ranging from 13.4% to 20.2% [Table 5]. The N-D cross plot shows that the lithology of this subunit is mostly dolomite to dolomitic limestone [Figures 9-11]. The average Sw and So of this subunit are 10.6%, 89.3%, and 20.6%, respectively [Figure 8].
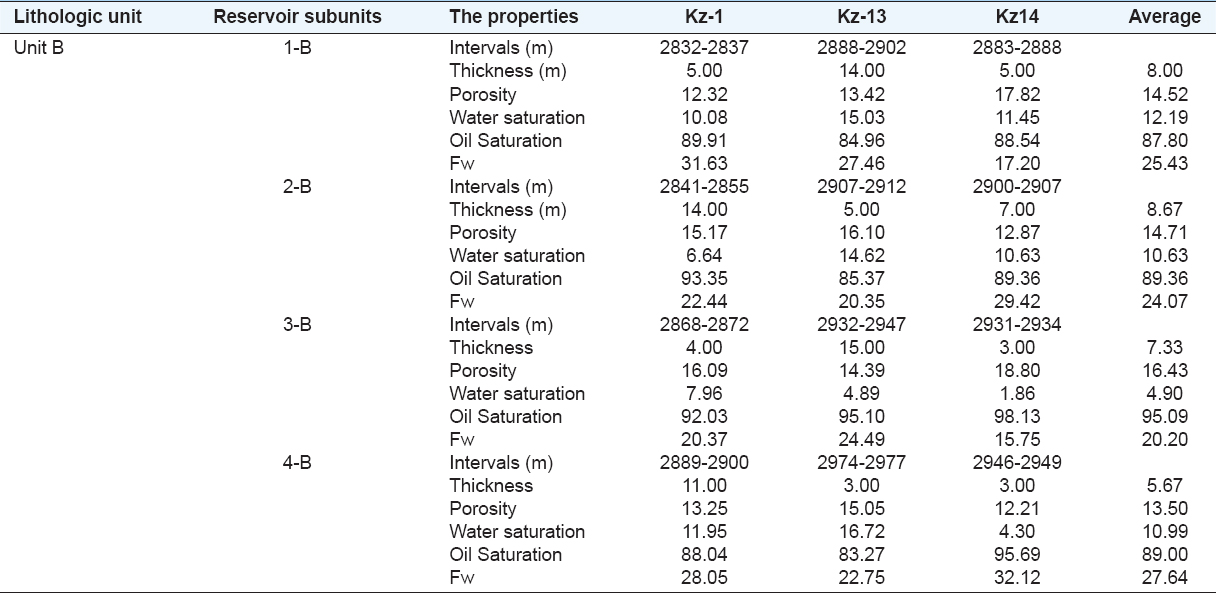
3.12. Unit B
Unit B represents the lower part of Upper Qamchuqa Formation. Its thickness ranges between 76 to 99 m [Table 4]. Unit B is characterized by having lower porosity compared with Unit A, as a result, the quality of the Upper Qamchuqa reservoir decreases with depth. According to lithology and porosity changes, Unit B has been subdivided into four reservoir subunits (1-B, 2-B, 3-B, and 4-B) with five non-reservoir subunits named as 1-N, 2-N, 3-N, 4-N, and 5-N [Figure 12]. The reservoir fluid of each subunit has been found and compared with porosity [Table 6 and Figure 13]. The N-D cross plot [Figures 14-16] shows the lithology of this unit is mostly composed of limestone and dolomite to dolomitic limestone.
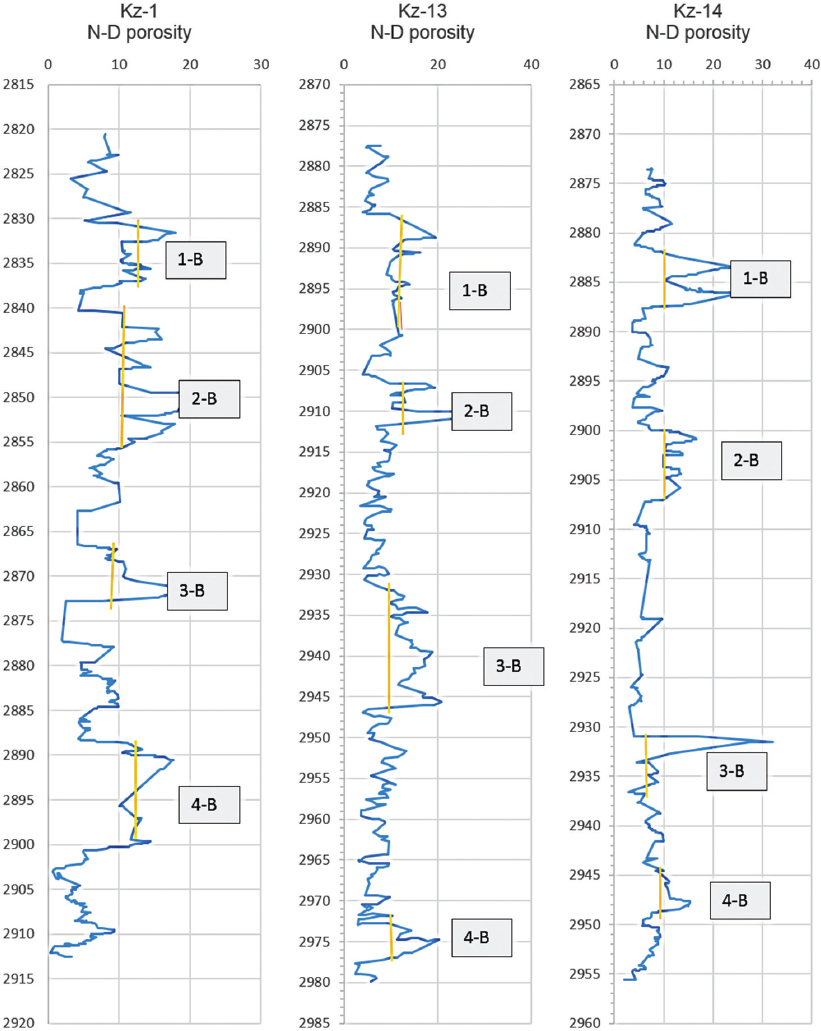
Figure 12. Unit B shows the various reservoir and non-reservoir subunits in the wells Kz-1, Kz-13, and Kz-14
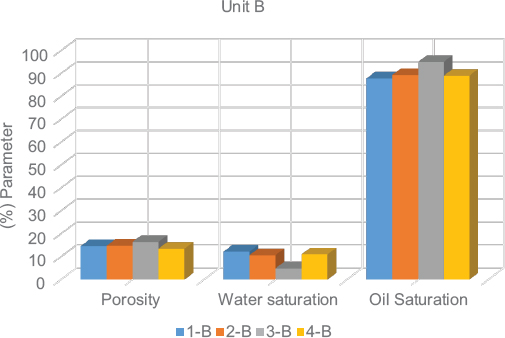
Figure 13. Diagram shows the relationship between average porosity, water saturation (SW), and oil saturation (SO) in all of the reservoir subunits of Unit B in the Kz-1, Kz-13, and Kz-14 wells
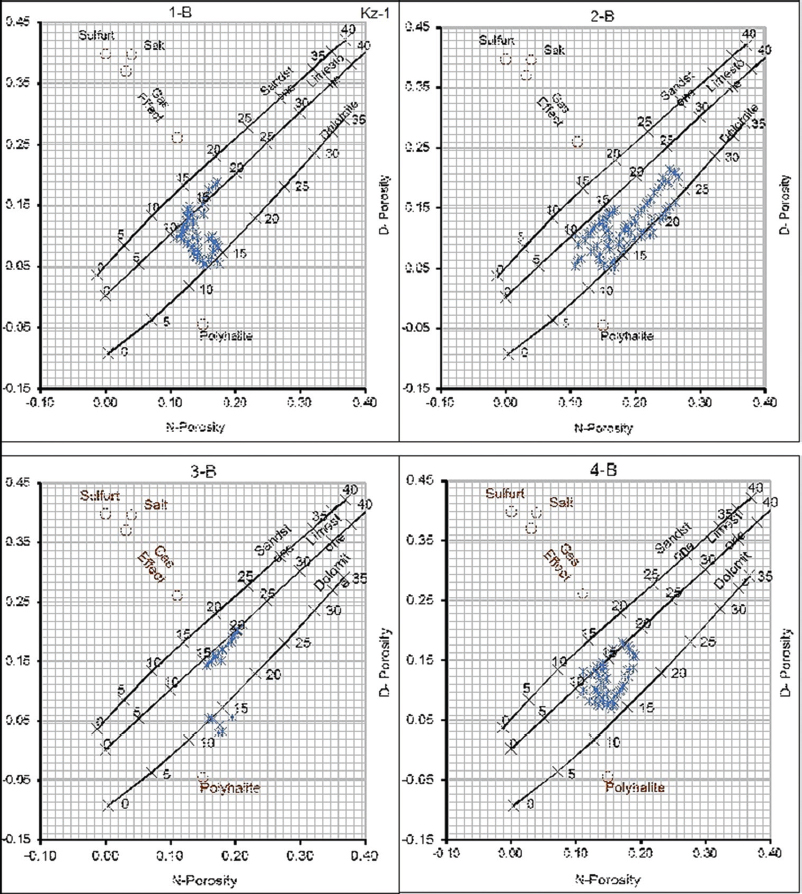
Figure 14. N-D cross plot of Kz-1 for Unit B. Subunit 1-B is dolomitic limestone with porosity of 10–15%. Subunit 2-B is dolomite to dolomitic limestone with porosity of 10–25%. Subunit 3-B is dolomitic limestone with porosity of 15–20%. Subunit 4-B is limestone to dolomitic limestone with porosity of 10–15%
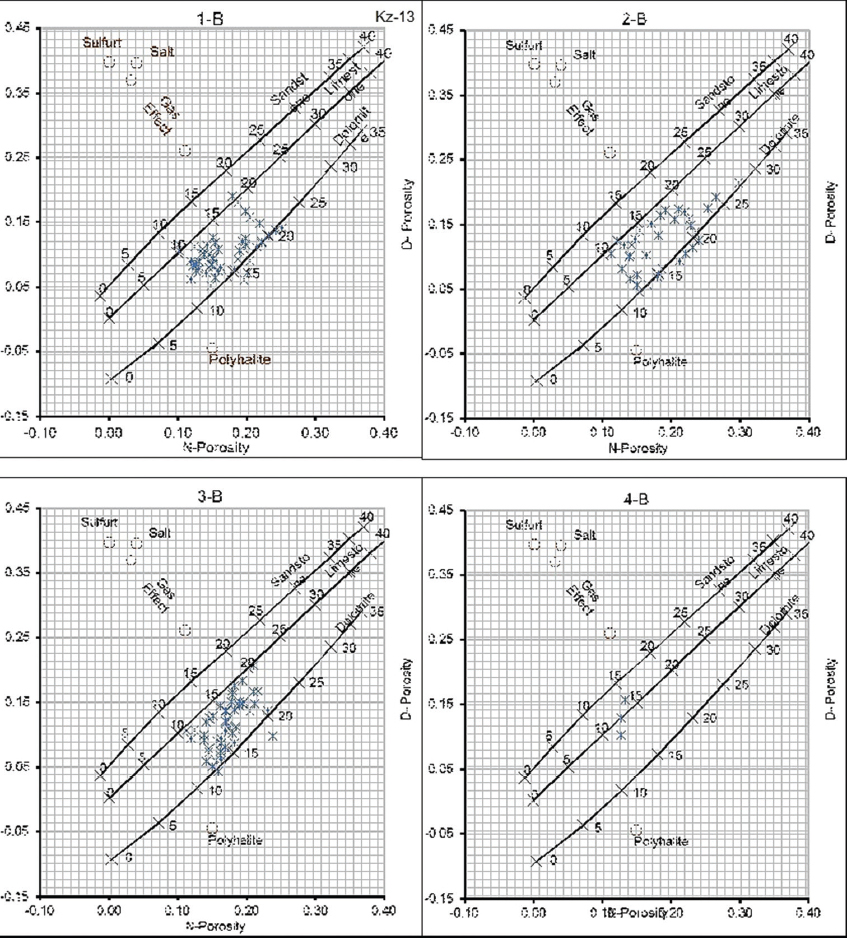
Figure 15. N-D cross plot of Kz-14 for Unit B. Subunit 1-B is dolomite to dolomitic limestone with porosity around 15–25%. Subunit 2-B is dolomite to dolomitic limestone with porosity of about 10–15%. Reservoir subunit 3-B is dolomite to dolomitic limestone with porosity of 10–15%. Subunit 4-B is dolomite to dolomitic limestone with porosity around 10–15%
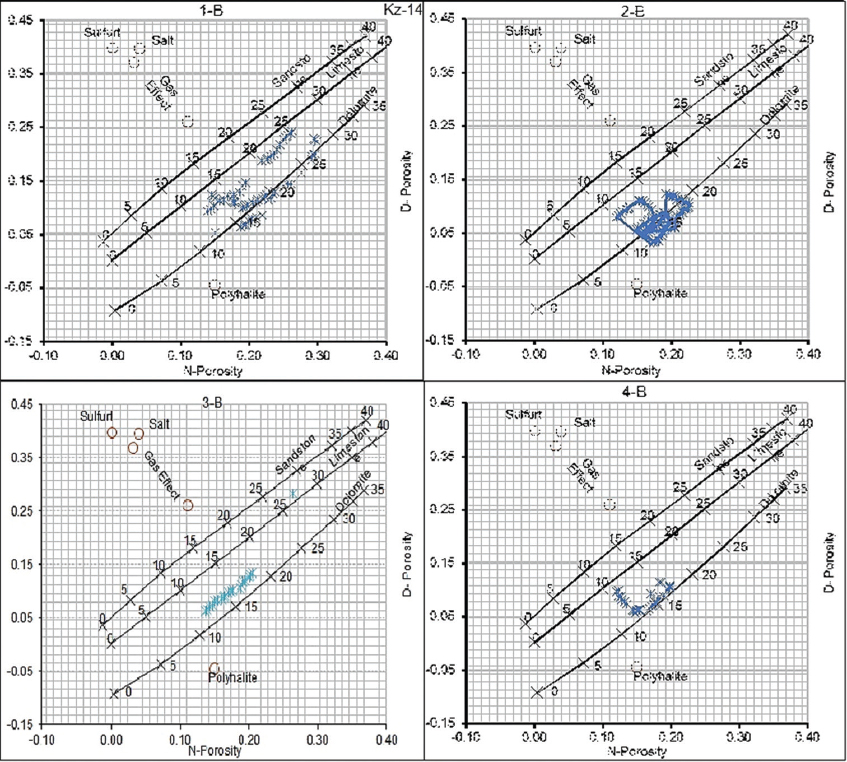
Figure 16. N-D cross plot of Kz-14 for Unit B. Subunit 1-B is dolomite to dolomitic limestone with porosity around 15–25%. Subunit 2-B is dolomite to dolomitic limestone with porosity of about 10–15%. Reservoir subunit 3-B is dolomite to dolomitic limestone with porosity of 10–15%. Subunit 4-B is dolomite to dolomitic limestone with porosity of around 10–15%
3.13. Reservoir Subunit 1-B
The interval thickness of this reservoir is variable from well to well; it is ranging from 5 m in Kz-1 and Kz-14 to 14 m in Kz-13 [Table 6]. The N-D cross plot [Figures 14-16] shows the lithology of this subunit to be dolomite to dolomitic limestone. The N-D combination porosity shows that the porosity of this subunit is ranging from 12.3% to 17.8%. The average water saturation, hydrocarbon saturation, and formation water of this subunit are 12.2%, 87.8%, and 25.4%, respectively [Figure 13].
3.14. Reservoir Subunit 2-B
The thickness of subunit 2-B varies from well to well. In well Kz-13, it has the minimum thickness of about 5 m, while in Kz-1, it has the maximum thickness of about 14 m. The N-D cross plot shows that the lithology of this subunit is mostly dolomite to dolomitic limestone [Figures 14-16]. The porosity of this subunit varies and it is ranging from 12.8% to 16.1% [Table 6]. The average water saturation and oil saturation of this subunit are 10.6 and 89.3, respectively [Figure 13].
3.15. Reservoir Subunit 3-B
The interval thickness of this subunit is 4 and 3 m in Kz-1 and Kz-14 and it increasing in Kz-13 to 15 m. The N-D cross plot illustrate that the lithology of this subunit is dolomitic limestone [Figures 14-16]. The N-D combination porosity shows that subunit 3-A has an average porosity of 16–19% in Kz-1 and Kz-14, respectively, and 14% in Kz-13 [Table 6]. The average water and oil saturation of subunit 3-B are 4.9 and 95.1, respectively [Figure 13].
3.16. Reservoir Subunit 4-B
This subunit is the base of Unit B. The thickness of this subunit varies from well to well, which it has minimum thickness in Kz-13 and Kz-14 of about 3 m and 11 m in Kz-1. The average porosity of this subunit is around 13.5% with minimum porosity of 12.2% in Kz-14 and maximum porosity about 15% in Kz-13 [Table 6]. The lithology of this subunit has been evaluated by N-D cross plot which is dolomitic limestone in Kz-1 and Kz-13 while it shows limestone in Kz-14 [Figures 14-16]. The subunit of 4-B has an average water saturation and hydrocarbon saturation of 11% and 89%, respectively [Figure 13].
4. DISCUSSION
The Upper Qamchuqa Formation is the main productive formation in the Khabbaz Oilfield; the lithology mainly consists of dolomite to dolomitic limestone and limestone based on the analytical results. Increases in gamma ray log and decreases the density and sonic logs have being observed which indicates that the top of the Upper Qamchuqa reservoir is being overlined by the Dukan formation, and an increase in gamma ray log and decreasing sonic, N-D logs in the bottom of the Upper Qamchuqa indicates that it is underlined by the Upper Sarmord Formation. A similar relationship recorded in the Kirkuk Jambour andKhabbazoilfields (Al-Shdidi et al., 1995; Al-Juboury et al., 2006; Ameen, 2008; Qadir, 2008; Al-Qayim et al., 2010; Al-Qayim and Rashid, 2012).
In this study, the Upper Qamchuqa Formation is divided into two main units with several subunits based on lithology and porosity variation with the response of logs. The results show that Unit A has the highest porosity with an average 19% from all subunits, while Unit B has only average porosity around 14% from all subunits. This concludes that the upper part of this formation has the higher reservoir quality.
The Upper Qamchuqa Formation has being studied by Qadir (2008) and Al-Qayim and Rashid (2012) in the Khabbaz and the TaqTaq oilfields, respectively. The earlier study subdivided the formation into three main units based on lithological variation confirming the upper unit has the best reservoir characteristics, while later divided the Upper Qamchuqa into four units based on porosity variation as follows: The first unit has average porosities of 15 %, the second unit is 7.5%, the third unit is 7%, and the fourth unit is only 4%. Both studies concluded the same result confirming that the upper part of the formation has the highest porosity ratio with the best reservoir quality comparing with other units.
5. CONCLUSION
The study of three wells of the Upper Qamchuqa reservoir in the Khabbaz oilfield using different types of log interpretation leads to improvements in evaluation and understanding of the reservoir characteristics of this field. Conclusions could be summarized as follows:
-
Shale volume is the main factor that affects the reservoir quality, as shale volume increases the reservoir quality decreases. All reservoir sections of the Upper Qamchuqa are almost clean formation and have minimal volumes of shale.
-
The upper part of the Upper Qamchuqa reservoir is divided into six reservoir subunits (1-A, 2-A, 3-A, 4-A, 5-A, and 6-A, which can be characterized as best reservoir properties. While, the lower part of the Upper Qamchuqa reservoir was divided into four reservoir subunits 1-B, 2-B, 3-B, and 4-B in which the quality is lower than reservoir Unit A.
-
The calculated porosity from the combination of N-D was compared with sonic porosity. It varies from 19% in Unit A to around 14% in Unit B.
-
The Upper Qamchuqa reservoir is mainly composed of limestone and dolomite to dolomitic limestone lithological units.
-
Both A and B units have low average water saturation and high average hydrocarbon saturation around 90%.
In this study through well log evaluation, it has been determined that the reservoir units of the Khabbaz oilfield contain massive commercial hydrocarbon due to high porosity and high hydrocarbon saturation in each pay zone.