1. INTRODUCTION
The Sargelu Formation was first described by Wetzel in Bellen et al., 1959 at Surdash Anticline, Sulaimaniyah district, located in northern Iraq, in High Folded Zone area. The age of the formation determined most Upper Liassic to the Bathonian age (Bellen et al., 1959). The formation is well-known as potential source rock and is the main hydrocarbon charge for the Jurassic and Cretaceous reservoirs (Jassim and Al-Gailani, 2006, Aqrawi et al., 2010). The Sargelu Formation has rather uniform lithological setting that encountered and consists of streaks of thin black chert within black papery shale, dolomitic limestone and thin-bedded black bituminous limestone (Bellen et al., 1959). The lithological composition of the Sargelu Formation is nearly same composition in the outcrops and subsurface (wells) along the whole area (Buday, 1980). The thickness of the formation in the outcrops can be 20–125 m in the High Folded and Imbricated Zones (115 m in its type locality section). However, in the subsurface sections, it is between 250 and 500 m in the Foothill and Mesopotamian Zones (Unstable Shelf) (Ditmar et al., 1971).
The Late Triassic - Early Jurassic was the time of opening the Neo-Tethys (Dercourt et al., 1986). Iraqi Unstable Shelf changed to a deep-sea environment due to the Neo-Tethys opening and subsidence of the Unstable Arabian Shield (Numan, 1997). Marouf (1999) believes that due to the cooling of the adjacent oceanic crust that results crustal under loading, there was increasing in the deepening and subsidence of the basin to Eastward. There was a major change in depositional setting, and climate pattern occurred during the Middle Jurassic. There were rare evaporates deposition and more humid climate (Murris, 1980). Liassic sedimentary basins had changed to euxinic basins, and the sedimentation setting became more uniform (Buday, 1980).
In Iraq, the Sargelu and Muhaiwir formations represent the Middle Jurassic [Figure 1]. The Sargelu Formation has a broad geological distribution in Iraq, and the depositional basin was NW-SE trends (Balaky, 2004). The western edge shoreline of the basin was represented by the Rutba-Jazeera Zone, and the eastern shoreline with the zone of western Iran, Sanandaj-Sirjan Block (Jassim and Karim, 1984). The Sargelu Formation geographic distribution extends toward southeastern Iraq, Kuwait, and southwestern Iran in Lurestan zone and partly Khuzestan region from Geosyncline of Zagros (Darvichzada, 1992). The main aim of this study is to address the source rock potential and lateral changes in thermal maturity of organic matter (OM) of the Sargelu Formation in the selected sections as following: (1) Banik village near Zakho Town, (2) Barsarin village near Rowanduz, Balak, and (3) Walasimt village near Said Sadiq Town. According to the Iraqi Tectonic Division (Jassim and Buday, 2006), these sections are within the Imbricated (Balambo - Tanjero) and High Folded Zones [Figure 2].
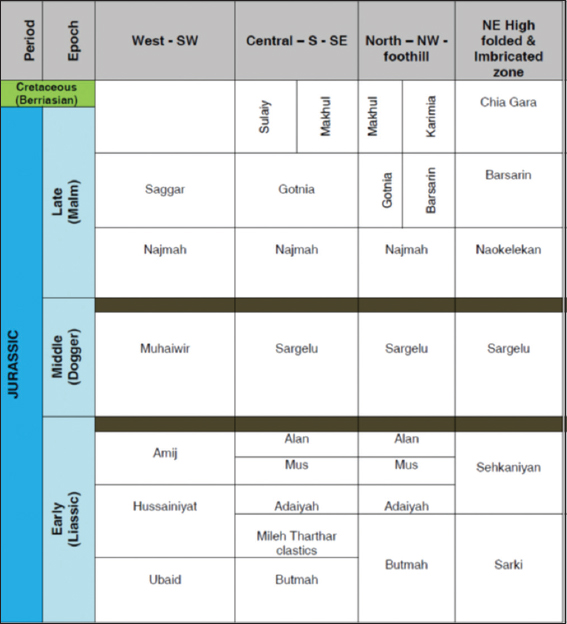
Figure 1. Stratigraphic correlation of Jurassic formations in Kurdistan Region and North Iraq (compiled from Dunnington, 1958, Bellen et al., 1959, Buday, 1980, Al-Sayyab et al., 1982, and Jassim and Goff, 2006). The dark belts at the end of Early and Middle Jurassic in the figure refer to Hiatus. (Figure is taken from Al-Badry, 2012)
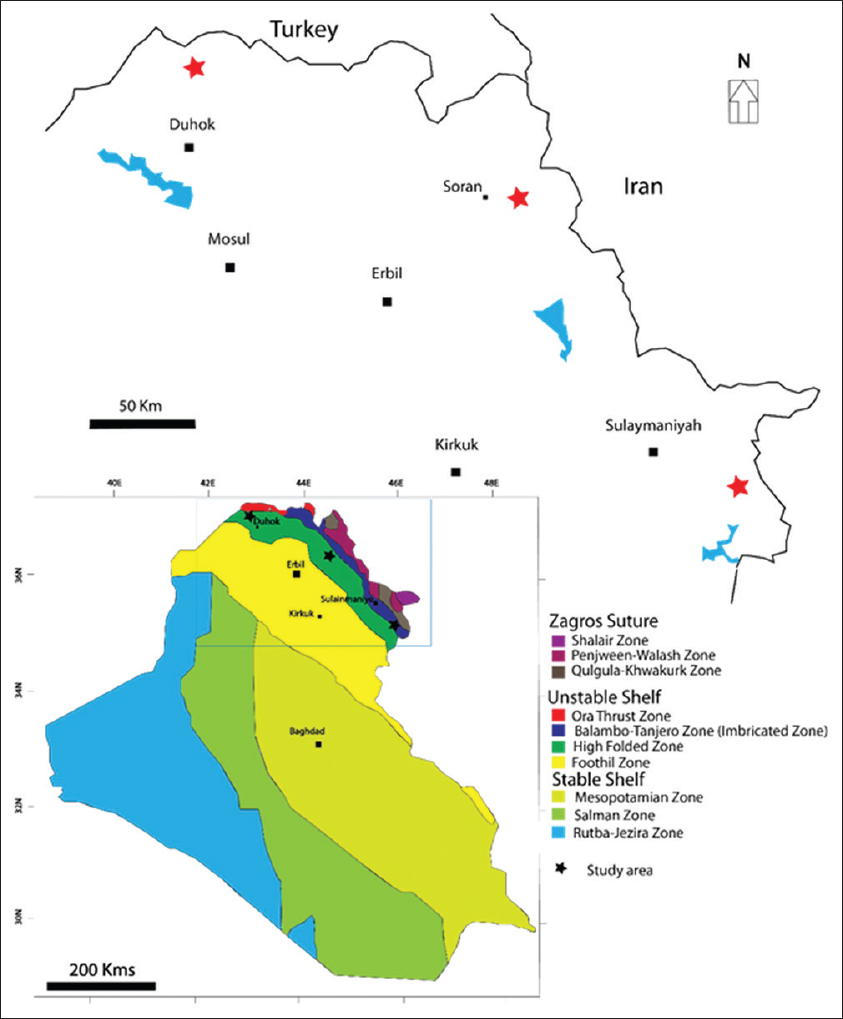
Figure 2. Main tectonic zones of Iraq and approximate locations of the studied areas (Maps are modified from Numan, 2000, Jassim and Buday, 2006, Sissakian and Al-Jiburi, 2014, and google map 2017)
2. PREVIOUS STUDIES
Al-Barzanji (1989) though that the Sargelu Formation was deposited in the euxinic marine basin. The generation and migration of hydrocarbons of the Sargelu Formation were studied by Othman (1990), he concluded that the OM of the Sargelu Formation belongs to Type II and Type III kerogen. Beydoun (1993) evaluated the formation as a potential source rock that had entered into oil generation stage in the Late Eocene and entered into condensate and gas generation at present day. Pitman et al. (2004) believed that the common source rock for hydrocarbon generation in Folded Belt and Zagros Thrust Zone is the carbonate and shale rock units of the Jurassic (mainly the Sargelu Formation). The lower part of the Surmeh Formation in Iran and Dhruma Formation in Saudi Arabia is the age equivalent to the Sargelu Formation (Jassim and Buday, 2006). Abdula (2010; 2014) in his study on the Sargelu Formation concluded that the OM of the Sargelu can be Type II and III kerogen. The most recent study on the Sargelu Formation in Miran Oil Field by Fatah and Mohialdeen (2016) reveal that the main kerogen type of the Sargelu Formation is a mixed Type II/III kerogen and is thermally post mature and in the gas generation zone.
3. MATERIALS AND METHODS
3.1. Field Work
To obtain rock samples, a detail field-work was carried out in one session, August 2016. During fieldwork the sections were logged with a detail description of the outcrops, for examples, the thickness of formation, lithology, and optical properties such as color were recorded in the logs. Due to some official difficulties, no well data were used in this study.
3.2. Lab Works
Rock-Eval pyrolysis was done in the Soran University (Scientific Research Center). The gas chromatography-mass Spectrometry (GC-MS) samples were analyzed in the Department of the Geology and Petroleum Geology in University of Aberdeen- Scotland/UK.
3.3. Rock-Eval Pyrolysis
One of the most important techniques in organic geochemistry for source rock appraisal is using Rock-Eval Pyrolysis (Espitalie et al., 1997; Whelan and Thompson-Rizer, 1993). The Rock-Eval pyrolysis method consists of a programmed temperature heating (in a pyrolysis oven) in an inert atmosphere (helium) of a small sample to quantitatively and selectively determine: (1) The amount of free hydrocarbons (S1), (2) the amount of hydrocarbons generated through thermal cracking of nonvolatile OM (S2), (3) the amount of CO2 produced during pyrolysis of kerogen(S3), and (4) the temperature at which the maximum release of hydrocarbons from cracking of kerogen occurs during pyrolysis (Tmax), it is an indicator of OM maturity stages.
3.4. GC-MS Analysis
GC-MS analysis was carried out with an Agilent Technologies (AT) 6890N Network GC (pulsed splitless) system fitted with a 30.0 m×250.0 µm i.d film thickness 0.25 µm fused silica DB-5 column coupled to an AT 5975 quadrupole mass selector detector (electron energy 70 eV, source 250°C) with He as carrier gas, normal initial flow: 1.3 mL/min. The GC temperature program for saturated hydrocarbons was hold at 60°C for 2 min, rising at 20°C/min–120°C, and then rising at 4°C/min–290°C and then holding for 23 min. Data acquisition was controlled by CHEMSTATION software in ion selection monitoring for saturated.
4. RESULTS AND DISCUSSION
4.1. Biomarkers Characteristics of the Sargelu’s extractable organic matter
The biomarkers indicate the specific OM input and the condition of its depositional environment, and can be linked back to the natural precursors of algae, bacteria, and other plants from that they are derived (Hunt, 1996). Biomarkers are used to determine the depositional environment, OM input, thermal maturity, oil-source, and oil-oil correlation (Peters et al., 2005). Aliphatic fractions in biomarker analyze for the compound are focused on four groups; isoprenoid, n-alkanes, steranes, and terpenes.
4.2. Acyclic Alkanes and Isoprenoids
Hydrocarbons of n-alkanes and isoprenoids can be identified and described from their mass spectra in the total ion chromatogram (TIC), and the m/z 85 ion chromatogram [Figure 3]. Elevated m/z 183 fragments and their molecular ion (M+) were used to identify the isoprenoids typically in the mass spectra.
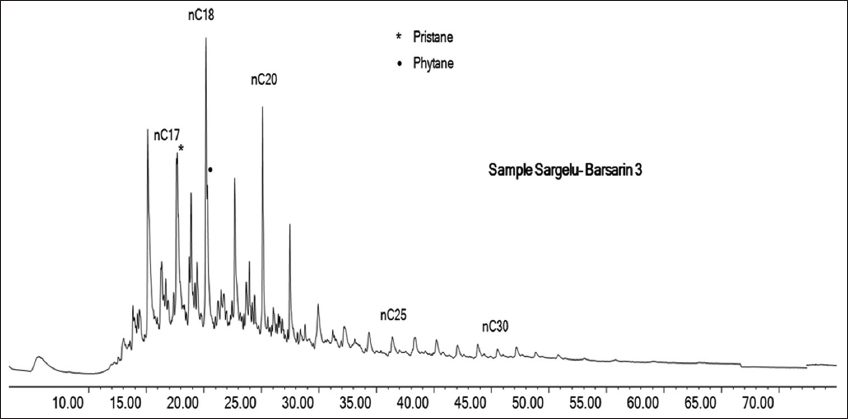
Figure 3. Chromatograph of the n-alkanes and isoprenoids distribution (m/z 85) in sample No. 3 of the Sargelu in Barsarin section
4.3. N-alkane Ratios (Pristane/Phytane)
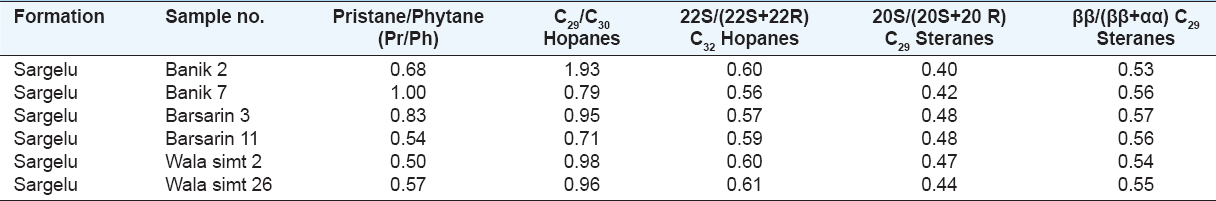
The Pr/Ph ratios are commonly used to deduce the oxic/anoxic nature of the source of OM and depositional environments (Peters and Moldowan, 1993). The high Pr/Ph ratios are thought to be associated with OM which subjected by oxidation to the phytol side chain of chlorophyll since this oxidation leads to the formation of the pristane (Peters and Moldowan, 1993). It is also believed that both pristane and phytane were derived from the phytol side chain of chlorophyll (Powell and Makirday, 1973). It is difficult to obtain a conclusive interpretation of redox conditions in the depositional environments using Pr/Ph ratio; therefore, these ratios should be used with caution. However, it is recommended that Pr/Ph ˃3.0 indicates oxic depositional environments, while between 1.25 and 2.13 could show anoxic to suboxic and a Pr/Ph ˂0.6 could indicate anoxic water column during the sediment depositional (Peters and Moldowan, 1993). All analyzed samples show Pristane/Phytane value <1.0 (the values range between 0.49 and 0.84), except one sample (1.0) [Table 1]. These values may show that the sediments of the Sargelu Formation deposited in an anoxic environment.
Table 1. Biomarkers parameters that are used in this study
4.4. Steranes
The distributions of regular steranes (C27, C28, and C29) can be obtained by the m/z 217 ion chromatograms [Figure 4]. The steranes are considered as significant biomarkers. It is believed that they are derived from sterols that are found in higher plants and algae, but rare or absent in prokaryotic organisms (Volkman, 1986). Distribution of the steranes could be used to identify source, type, and thermal maturity of OM (Seifert and Moldowan, 1979; Peters et al., 2005).
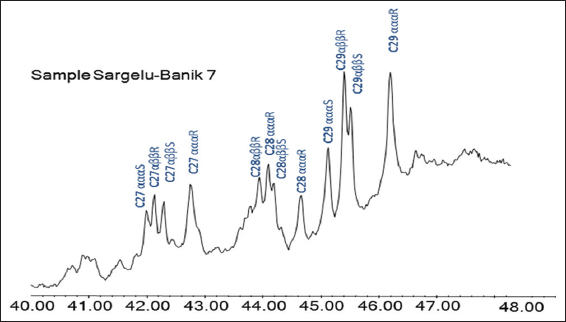
Figure 4. Chromatographs (GC-MS) show distribution (m/z 217) of sterane of the Sargelu Formation in Banik area
4.5. Thermal Maturity Parameters of the Steranes
The C29 sterane ratios (20S/(20S+20R) and ββ/(ββ+αα)) are frequently used as thermal maturity indicator for OM because C29 sterane ratios increase with increasing thermal maturity (Peters et al., 2005). The ratio of steranes isomerization 20S/(20S+20R) ranges from 0 to 0.5 with increasing thermal maturity (Peters et al., 2005). Likewise, due to isomerization at C-14 and C-17 in the C29 20S and 20R regular steranes, the ratios of ββ/(ββ+αα) tend to increase from 0 to 0.7 value (Peters et al., 2005). The C29 20S/(20S+20R) sterane ratios of 0.35 and 0.5 can be corresponded with Ro=0.6% and 0.8%, respectively (Waples and Machihara 1991; Peters and Moldowan 1993; Peters and Moldowan 1991). As shown in Figure 5 and Table 1, all samples are in Peak Oil Window at least, but the samples of the Wala simt and Barsarin areas are seem more mature than Banik area.
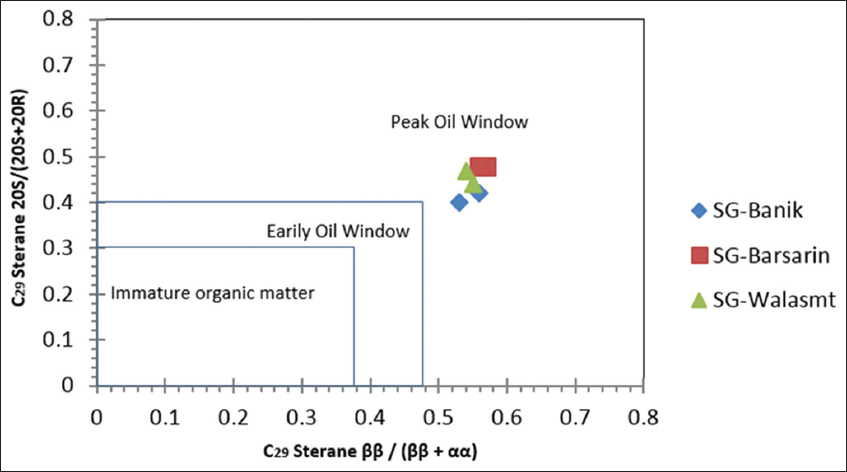
Figure 5. The plot of C29 steranes ββ/(ββ+αα) versus C29 steranes 20S/(20S+20R) for determining thermal maturity of extractable organic matter
4.6. Terpa nes (Hopanes)
The distribution and relative abundances of the terpanes obtained from m/z 191 ion chromatograms (Brooks et al., 1969; Peters et al., 2005) [Figure 6]. There are some terpanes parameters that can be used to assess the depositional environment of the sediments such as tricyclic and tetracyclic terpanes, Ts/Tm ratio, C29/C30 ratio, Gammacerane. In this study, only C29 hopane/C30 hopane ratio was used for assessment of the depositional environment. C30 hopane is associated with clay-rich source rock (shale), while the dominance of C29 hopane indicates carbonate and evaporate sediments (Waples and Machihara, 1991). As shown in Table 1, the samples of the Sargelu Formation seem to be associated with clay-rich source rock.
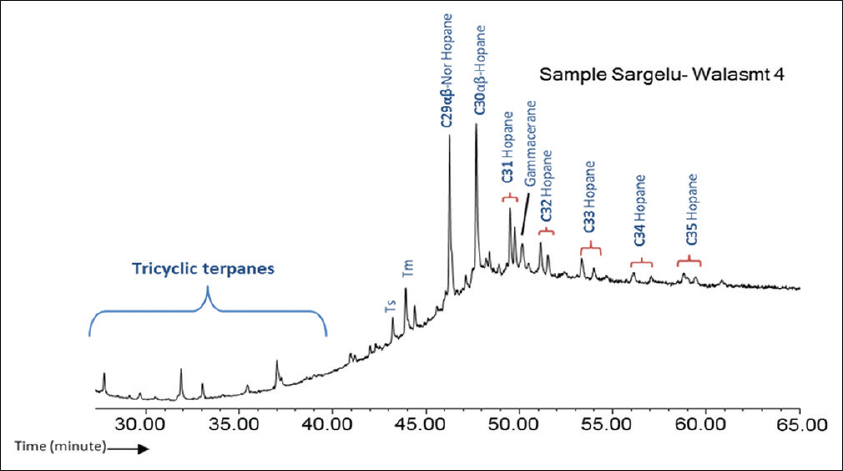
Figure 6. Chromatographs gas chromatography-mass spectrometry of hopane (m/z 191) for sample No. 4 of the Sargelu in Wala simt
There are some parameters of terpanes can also provide significant information on thermal maturity of the EMO and oils. Thermal maturity of the oils and extracted OM can be evaluated using the following biomarker parameters: Hopane isomerization C32 αβ 22S/(22S+22R), C27 Ts/(Ts+Tm) hopanes, and C30βα-moretane/C30 αβ hopane ratio (Seifert and Moldowan, 1978; Mackenzie et al., 1980; Moldowan et al., 1985; Peters and Moldowan, 1993; Peters et al., 2005). The equilibrium value of the C32 22S/(22S+22R) hopanes epimerization ranges from 0.55 value to 0.6 (0.57–0.62 equilibrium) (Waples and Machihara, 1991). The samples that have 22S/(22R+22S) ratios in the range 0.50–0.54 are in Early Oil Window (low mature), whereas samples with ratios in the range 0.57–0.62 show that they have reached to Peak Oil Window at least (Peters et al., 2005). In current study, the 22S/(22R+22S) ratios show that all samples are in Peak Oil Window [Table 1 and Figure 7]. Due to lithological influence on the C27 Ts/(Ts+Tm) ratio, it was not used in the assessment of the thermal maturity of OM in this study. All thermal maturity parameters of steranes and hopanes show that the extracted OM of the Sargelu Formation has been reached Peak Oil Window. The notable point is that the samples from the east of Kurdistan Region seem to be more mature than west [Table 1 and Figures 5 and 7].
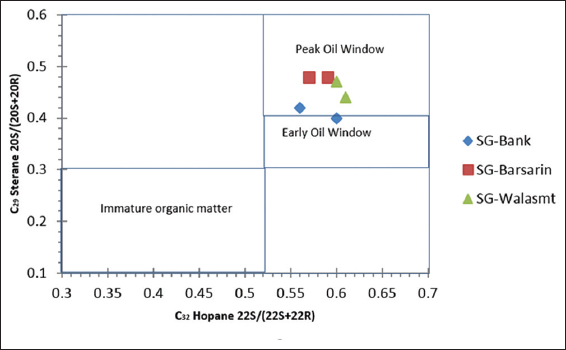
Figure 7. The Plot of C32 Hopanes 20S (20S+20R) versus C29 Steranes 20S (20S+20R), indicating the level of thermal maturity of organic matter
5. SOURCE ROCK EVALUATION
Those sedimentary rocks which may have been able or it becomes to generate petroleum are called source rocks (Tissot and Welte, 1984). Qualitative source rock is a rich organic compound which generated the petroleum in appropriate condition under influence of temperature and time (Rullkötter, 1987). The Rock-Eval Pyrolysis technique provides information about thermal maturation and type of the organic from prospective potential source rocks (Peters, 1986).
5.1. Total Organic Carbon (TOC)
The quantity of organic carbon in a source rock which contains kerogen and bitumen are called TOC that represents by percentage of weight (TOC and weight %), (Peters and Cassa, 1994). The values of the TOC from pyrolyzed samples are shown in Table 2. The TOC values are between 0.05 and 12.07. Wala simt samples show the lowest values. However, the Banik samples display the highest values of TOC. The Wala simt and Barsarin samples indicate Poor to Fair source rock quality, respectively, but samples of the Sargelu Formation in Banik area can be considered as Good to Excellent source rock quality. Very low TOC values in the Wala simt may be resulted of the contamination. S1 (mg/g of rock) peak is the total amount of free hydrocarbon measured during the first stage of pyrolysis analyze at the fixed temperature of 300ºC. Analyzed samples show the values are ranging from 0.01 to 0.25. The lowest value is from the Wala simt area (0.01 mg HC/g rock), while the highest value can be seen in Banik area (0.25 mg HC/g rock) [Table 2]. All analyzed samples show poor quality for the source rock petroleum potential. S2 (mg/g of rock) indicates the amount of hydrocarbon that generated from cracking of kerogen from source rock in the second stage of pyrolysis. As shown in Table 2, the S2 values for the Sargelu Formation in Banik area show the highest values (3.18 and 48.24 mg HC/g rock) in which the OM can be considered as Fair and Excellent quality for petroleum potential. On the other hand, the samples of the Wala simt and Barsarin sections indicate poor petroleum potential quality. By plotting S2 versus TOC, OM of the Sargelu Formation can be lean OM in Barsarin and Wala simt, while it can be considered as Type II and IV in Banik area [Figure 8]. Production Index (PI) [S1/(S1+S2)] also called Transformation Ratio which is referring to the amount of hydrocarbon which has been produced relative to the total amount of hydrocarbon from a rock sample (Nunez-Betelu and Baceta, 1994, Tissot and Welte, 1984). By plot PI versus Tmax, it can be deduced that the OM of the Sargelu Formation in Banik area is in Oil Window and early stage of hydrocarbon generation. However, in Barsarin and Wala simt area, it seems to be in Gas Window and higher level of hydrocarbon conversation (overmature) [Figure 9].
Table 2. The values of Rock-Eval Pyrolysis parameters for the sample of the Sargelu Formation
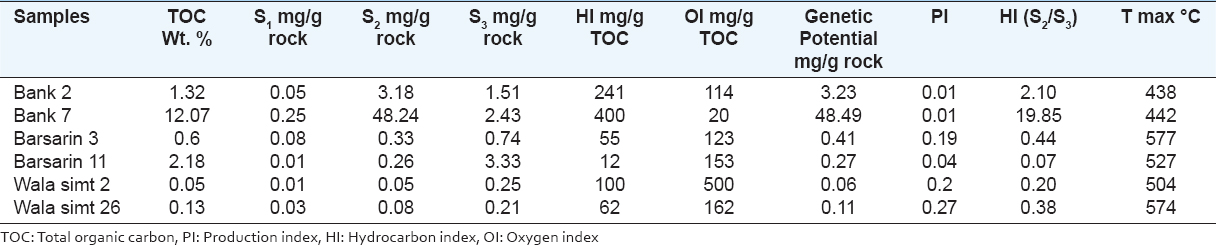
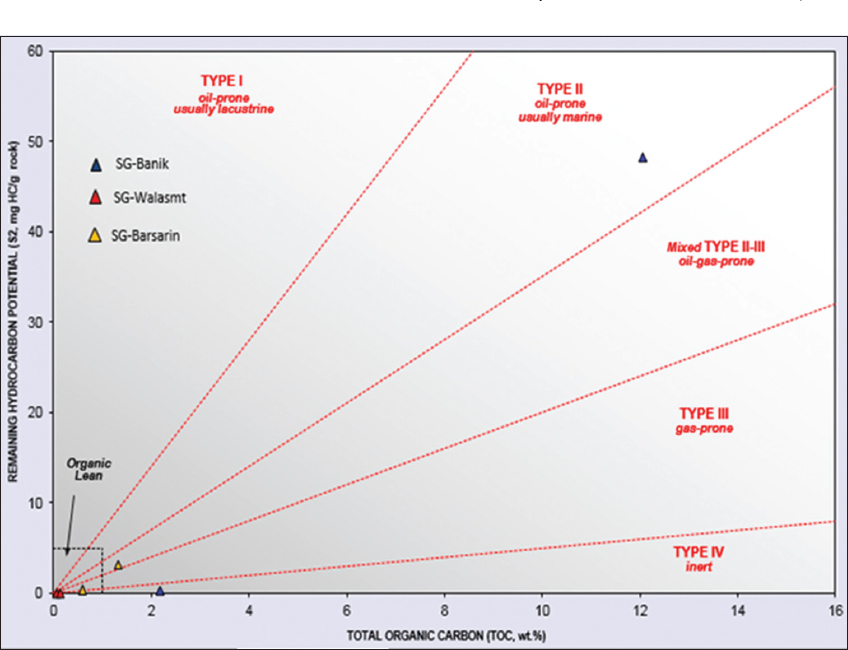
Figure 8. Total organic carbon (total organic carbon wt.) versus remaining hydrocarbon potential for the studied sections
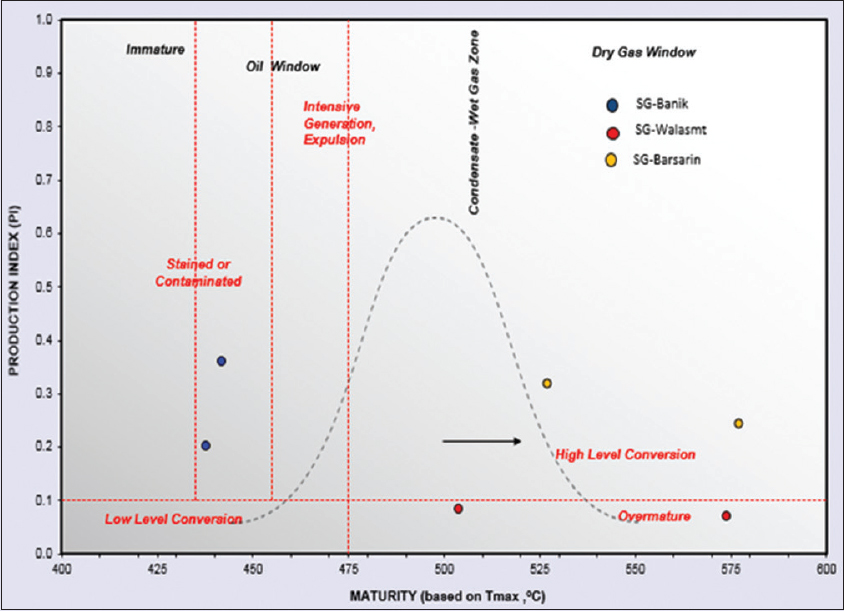
Figure 9. Tmax versus production index for the samples from (Banik, Wala simt, and Barsarin). The samples in Banik area are in the early oil window, while the samples of the Barsarin and Wala simt sections are in overmature zone
Kerogen is high molecular-weight of compound which consists of OM within sediments (Whelan and Thompson-Rizer, 1993). Kerogen is insoluble in aqueous alkane solvents and solvents of common organic (Tissot and Welte, 1984). Due to variation in chemical structure, a different type of OM has different kerogen type (Tissot and Welte, 1984).
The hydrocarbon index (HI) [S2/S3] is the ratio of the amount of hydrocarbon which a source rock can produce (S2) relative to the amount of organic CO2 that release during temperature programming (Nunez-Betelu and Baceta, 1994). The samples of the Sargelu Formation show the values of 0.36–19.58. Based on the HI, the samples of the Sargelu in Banik area are considered as type I and III kerogen. However, samples of the Sargelu Formation from Barsarin and Wala simt indicate type IV kerogen. Type I kerogen displays highly oil-prone, type II kerogen oil-gas prone, type III kerogen gas prone, and type IV kerogen no hydrocarbon. Hydrogen Index and Oxygen index (OI) can be also obtained from the values of S2 and S3. HI value shows the amount of hydrocarbon from S2 or pyrolysable organic compound relative to the TOC that mathematically expressed as (S2×100/TOC). However, OI is determined as the quantity of CO2 from S3 value relative to the TOC, and it measured in milligram of carbon dioxide per each gram of TOC (mg CO2/g TOC). It can be calculated by the (S3×100/TOC) formula. The origin of hydrocarbon can be determined using these parameters; for example, HI shows the potential of source rock to generate petroleum (Tissot and Welte, 1984; Peters, 1986; Hunt 1996). Type I kerogen usually contains HI values >600 mg HC/g TOC; Type II kerogen normally has HI values 300–600 mg HC/g TOC; a mixture of Type II and Type III has a low Hydrogen Index 200–300 mg HC/g TOC; type III kerogen generally contains HI values 50–200 mg HC/g TOC, and Type IV kerogen commonly has HI values of <50 mg HC/g TOC (Tissot and Welte, 1984; Peters and Cassa, 1994). Based on the HI values, the Banik’s samples can be considered as Types II–III kerogen, and Barsarin and Wala simt samples are more likely Type III and mixed III–IV kerogen [Table 2]. By plotting the values of HI versus OI four main types of kerogen can be determined, but in some cases, such as coal rock and gas-prone coal may give anomaly of high HI value (Peters and Cassa, 1994). As shown in Figure 10, the kerogen type of OM for analyzed samples can be mixed Types II–III and III–IV. Thus, OM of the Sargelu Formation in Banik is more likely Oil-Gas prone, while in Barsarin and Wala simt it seems Gas-prone or inert. A high value of the OI is usually associated with rocks that containing remarkable quantities of primary carbonate minerals such as calcite, dolomite, and siderite (Katz, 1983). This case can be seen in one sample of the Wala simt [Figure 10].
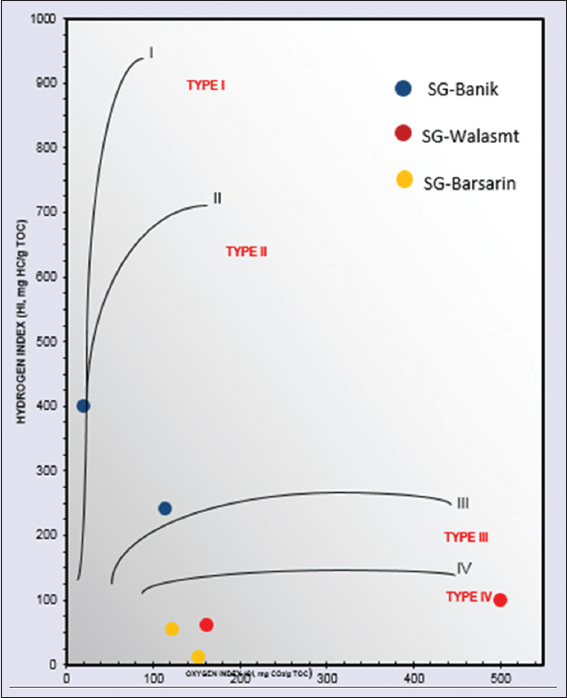
Figure 10. Hydrogen index (mg HC/g total organic carbon [TOC]) versus oxygen index (mg CO2/g TOC) show that kerogen type for the Sargelu sediments is belonging to mixed Types II–III kerogen for Banik area, and Type IV kerogen for Barsarin and Wala simt. Note; the OI value more than 250 may not reliable
Tmax is the highest temperature which on that temperature the maximum amount of hydrocarbon is degraded during Rock-Eval pyrolysis. The peak of S2 shows the value of Tmax. The Tmax value does not show the rock’s burial temperature; however, it can show the level of thermal maturity of the OM, there is gradually increase in Tmax value by increasing burial depth (Nunez-Betelu and Baceta, 1994).
In general, a value <435°C shows immature OM (immature zone), Tmax values between 435 and 455°C display mature OM (Oil Window). However, the values between 455 and 470°C show high mature OM (Transition zone-Gas Window). The values >470°C indicate Wet-Gas or the overmature zone (Peters, 1986) [Table 2]. Analyzed samples from studied sections show the value 438–442°C for Banik samples, 504 and 574°C Tmax for Walasimt. The Tmax values for the Barsarin are 577 and 527°C [Table 2]. All samples of Barsarin and Wala simt indicate the Post-Mature stage for the source rock, but the samples of Banik are in the Mature stage. The Tmax values of the Barsarin and Wala simt areas are abnormal and may be unreliable. Regardless of Tmax anomalous, results are in agreement with biomarkers data for thermal maturity. Moreover, by plotting Tmax versus HI, the samples of the Banik section are in early stage of maturity. However, both Barsarin and Wala simt sections show the post-mature level of thermal maturity [Figure 11].
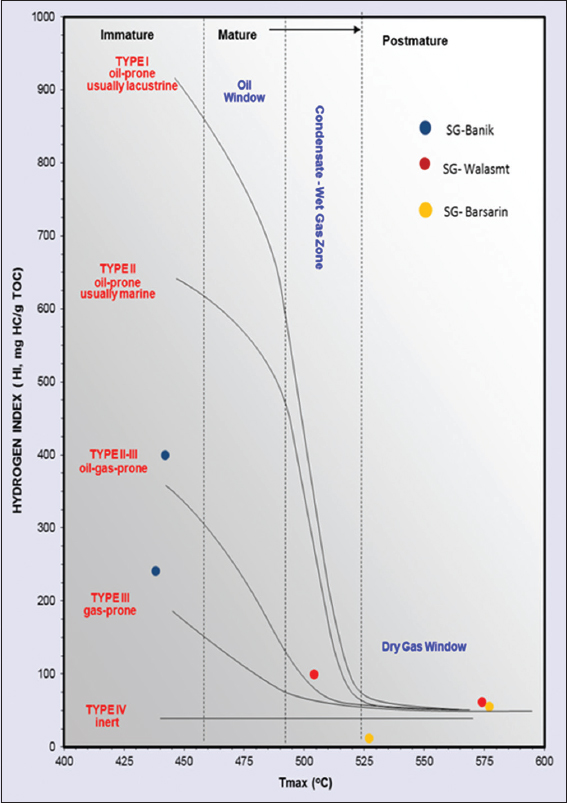
Figure 11. The plot of Tmax versus hydrocarbon index, and the level of maturity and Kerogen type for analyzed samples
6. SUMMARY AND CONCLUSIONS
Biomarker parameters such as Pr/Ph, C29/C30 terpanes ratios show that the OM of the Sargelu Formation was deposited in an anoxic depositional environment that associated with clay-rich source rock.
The geochemical analyzes (include Rock-Eval Pyrolysis and GC-MS) for six samples from all sections show the values of TOC wt. % decrease from northwestern (Banik area) toward north and northeastern of Iraq (Wala simt area). The TOC wt. % show the highest value in Banik section (12.07 mg HC/g Rock), and lowest value in Wala simt section (0.05 mg HC/g rock). The free hydrocarbon (S1) for the samples show poor quality in all sections, the values of S2 are also low, and the ability of source rock to generate petroleum is poor in Wala simt and Barsarin sections, while in Banik section it is fair.
The analyzed samples show that the OM is characterized by Types II–III kerogen for Banik section (Oil-Gas Prone), and mixed III–IV kerogen for Barsarin and Wala simt areas (gas-prone).
The biomarker parameters for thermal maturity such as steranes C29 20S (20S+20R), steranes C29 ββ/(ββ+αα), and C32 hopanes 22S/(22S+22R) show that all samples are thermally in Oil Window. However, the samples of Wala simt and Barsarin are thermally more mature than Banik section.
Tmax values for Banik area exhibit that OM is in the early stage of thermal maturity (Oil Window), while it is in Gas-Oil Window (Overmature) in Barsarin and Wala simt areas. The most significant conclusion in this study is finding the changes in thermal maturity from Wala simt to Banik area (from high thermal maturity to low thermal maturity). It was concluded that regardless of abnormal data of Tmax values, the Tmax values are consistent with biomarker parameters for thermal maturity. The differences in thermal maturity from a studied section can be due to the high amount of overburden sediments in the east in comparison to the west of Kurdistan region through geological history of the area.