1. INTRODUCTION
Petroleum reservoirs are porous and permeable rock bodies that contain commercial amounts of hydrocarbons. These fluids are contained in the pore spaces of rock formations and are interconnected so the fluids can move through the reservoir (Baker Hughes INTEQ, 1999). The main goal of a petroleum geologist is to determine the fundamental properties of reservoir rocks (reservoir characterization), such as porosity, permeability, fluid saturation, lithology, and volume of shale. The current research attempts to study reservoir characterization of some formations of Liassic Epoch in Northern Iraq from two exploration wells. Well logs for three Early Jurassic stratal units (Adaiyah, Mus, and Alan formations) are used to determine the properties of the investigated reservoir rocks [Table 1].
Table 1: Early Jurassic stratigraphic units in Iraq, showing studied stratal intervals
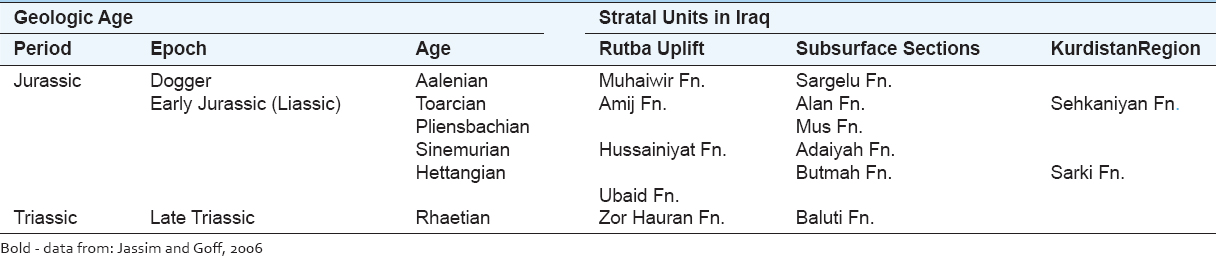
Alsharhan and Nairn (1997) showed that anhydrite bed of Adaiyah Formation represents good seals for Butmah Formation. They also assumed that Alan formation is a minor oil and gas reservoir in well Samawa-1 and that the hydrocarbons of that reservoir may be sourced from the younger Sargelu formation. Aqrawiet al. (2010) believed that the massive evaporites in Adaiyah formation and the associated shales are probably effective seals for the Butmah reservoir units. The Mus formation may also make a reservoir in southern Iraq, where it comprises carbonate (Al-Gailani 1998, cited in Aqrawiet al. 2010). In the current research, the anhydrite bed of Adaiyah formation can be considered a seal for the Butmah reservoir units. Furthermore, the Alan and Mus formation can act as a reservoir for hydrocarbons due to carbonate lithology and good porosity. The log data (recorded in LAS format) of the two studied wells were loaded into Interactive Petrophysics software (IP) and then used to determine the lithology, volume of shale, porosity, and water saturation.
2. GEOLOGIC SETTING
The Iraqi territory was divided by Jassim and Buday (2006a) into three main tectonic units. The first unit is the Stable Shelf, which covers most of central, southern, and western Iraq, with no surface anticlines (Jassim and Buday, 2006a). The second unit is the unstable shelf that extends over N and E; this unit is characterized by structural trends and facies changes parallel to the Zagros–Taurus suture belts. Surface folds are among its characteristic features (Jassim and Buday, 2006b). The unstable shelf is subdivided into four tectonic zones: The foothill zone, the high folded zone, the Balambo-Tanjero zone, and the Northern Thrust (Ora) zone (Jassim and Buday, 2006a). The third tectonic unit is Zagros suture. Considering these tectonic units, the selected wells would be located in the high folded and foothill zones of unstable shelf unit [Figure 1].
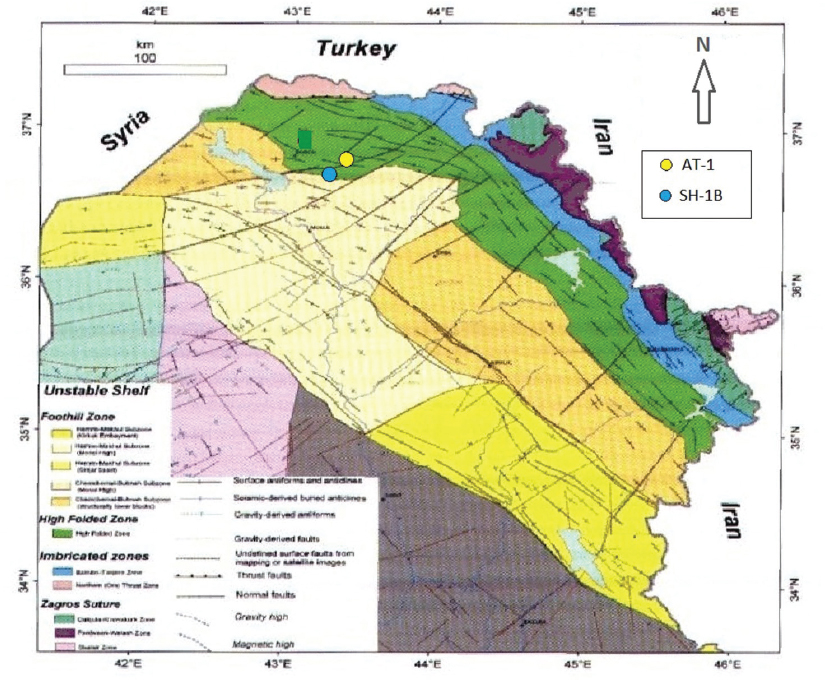
Figure 1. Tectonic map of Northern Iraq with the main structural trends, showing the location of the studied wells (Atrush-1 and Shaikhan-1B) (after Jassim and Goff, 2006)
3. METHODOLOGY
Well logs were the main source of data for the current study. The methods of study and data collection involve: (a) Description and identification of reservoir properties using different well logs, such as gamma ray, resistivity logs, sonic log, density log, and neutron log; (b) using Interactive Petrophysics Software (IP) Version 3.5 for well log analysis and identification of reservoir properties; (c) identification lithology and mineral composition of rock formation using neutron-density cross plot; (d) determination of total, effective, and secondary porosity by neutron, density, and sonic logs; and (e) constructing computer-processed interpretation (CPI) log for the two wells.
4. RESULTS AND DISCUSSION
4.1. Determination of Lithology and Mineralogy
Determining the lithology and mineralogical composition of the rock formation is too important for the evaluation of a reservoir. Lithology often describes the solid (matrix) portion of the rock, so for this study, the neutron-density cross plot method is chosen to estimate lithology of formations:
Neutron-density cross-plot has shown that the Alan formation, in both wells Atrush-1 (AT-1) and Shaikhan-1B (SH-1B), is composed of limestone, most points fall on the limestone line, and porosity ranges between 0 and 20% [Figures 2a and 3a]. The type section for the Alan formation in well Alan-1 comprises bedded anhydrite with subordinate beds of limestones (Van Bellenet al., 1959), and evaporite is gradually replaced by limestone in two wells. Mus formation composed of limestone in both wells, and the porosity ranges 0–20% [Figures 2b and 3b]. The type section for Mus formation in well Butmah-2 in Northern foothill zone is a limestone-dominated stratigraphic unit (Van Bellenet al., 1959). Adaiyah formation is composed of anhydrite, calcareous dolomite, and dolomite. In well AT-1, the porosity range is between 0–7% [Figure 2c]. At well SH-1B, this formation is composed of anhydrite, limestone, and dolomite. The porosity range decreases to 0–3% [Figure 3c], the type section for the Adaiyah formation is in well Adaiyah-1, and the formation comprises bedded anhydrite with subordinate beds of limestone (Van Bellenet al., 1959).
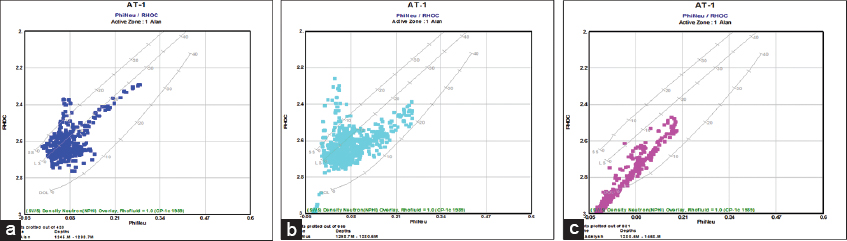
Figure 2. (a-c) Neutron-density cross-plot for formations in well Atrush-1 and Shaikhan-1B) (after Jassim and Goff, 2006)
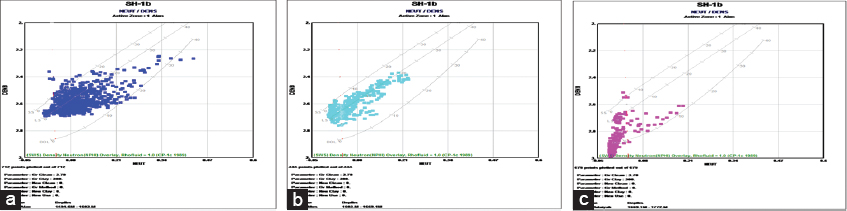
Figure 3. (a-c) Neutron-density cross-plot for formations in well Shaikhan-1B
4.2. Shale Volume (Vsh) Calculation
To determine the volume of shale (Vsh), the first step is to calculate the gamma-ray index (GRI) from GR log, using a formula of Schlumberger (1974), as shown in Equation (1):
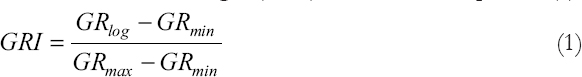
The calculated GRI is used to determine the Vsh for older rocks using the following Equation (2) from Schlumberger (1974):

A standard table, proposed by Ghorabet al. (2008), is used to distinguish zones of different shale content within rock formation in both wells [Table 2].
Table 2: Zonation based on the percentage of shale volume (after Ghorab et al., 2008)
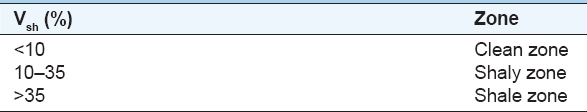
The volume of shale was calculated for all formations in the two well [see results in Figures 4 and 5]. Based on the standard values/limits of shale volume, as shown in Table 2, all formations in both wells are considered clean formations except for the Alan formation in well SH-1B, located in a Shaley zone [Figure 5].
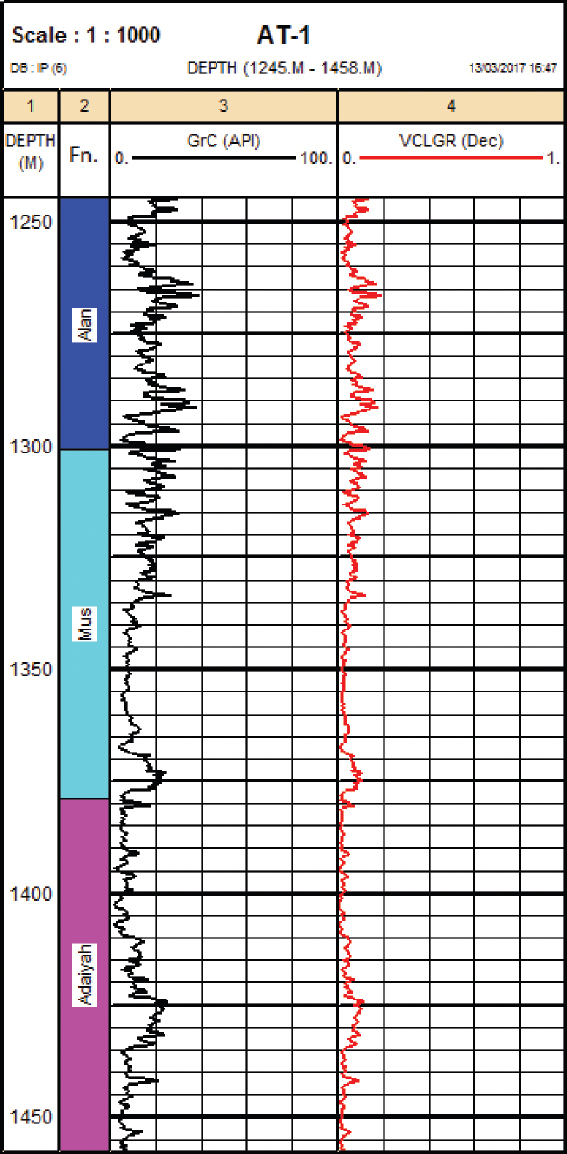
Figure 4. Clay volume variation with depth for well Atrush-1
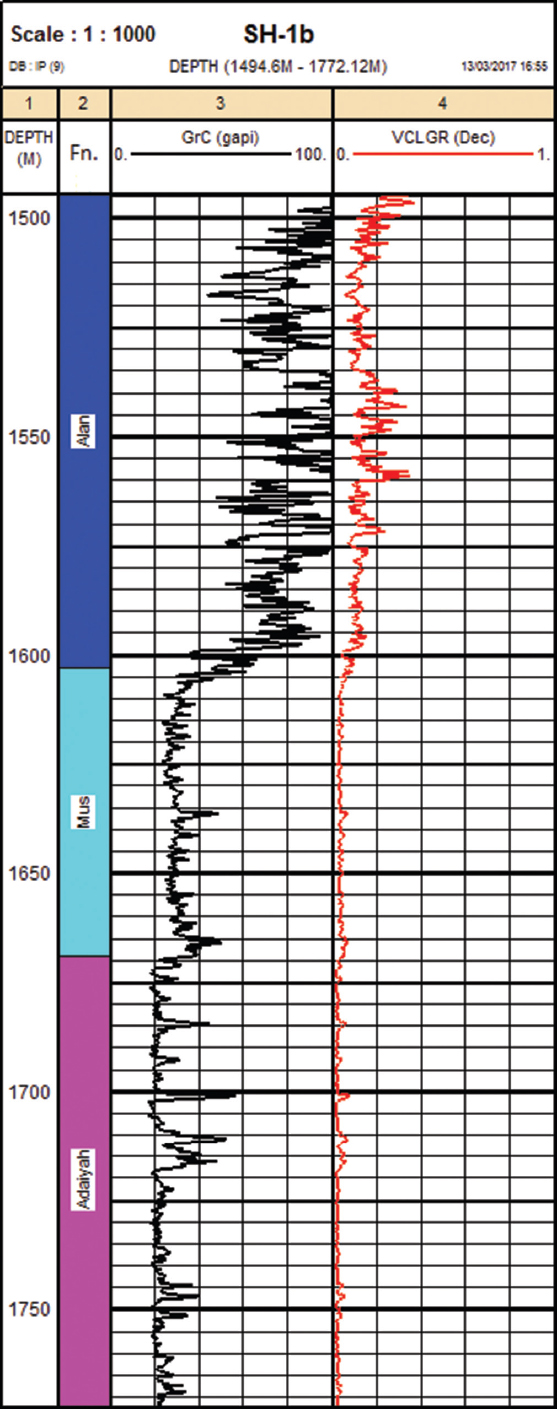
Figure 5. Clay volume variation with depth for well Shaikhan-1B
4.3. Porosity Determination from Porosity Logs
Total porosity is all pore space in a rock, whether effective or non-effective. Schlumberger (1974) proposed this Equation (3) to calculate total porosity from neutron and density logs:

The effective porosity is total porosity minus the fraction of the pore space occupied by shale. Effective porosity is calculated from the Equation (4):

Secondary porosity is porosity formed post-depositional. Such porosity results from groundwater dissolution, recrystallization, and fracturing (Link, 1982). Secondary porosity can be computed by the secondary porosity index (SPI), as calculated from Equation (5):

The total porosity of formations in a studied interval is measured by Interactive Petrophysics Program from neutron and density logs. The difference between the total porosity, calculated from these logs and the sonic log, will give a SPI, and then, we can calculate the effective porosity after correcting the logs or total porosity from the effect of clay. Figures 6 and 7 show the calculated values of these porosity types and their variation with depth in wells AT-1 and SH-1B. It is obvious that porosity is varied from one formation to another. In well AT-1, the maximum effective porosity is observed in Mus formation, whereas the minimum is noticed in Adaiyah formation. Secondary porosity is high in Mus when compared to other formations of low records of secondary porosity. At well SH-1B, the maximum effective porosity is observed in Alan formation, while the minimum value is recorded in Adaiyah formation. High secondary porosity is noticed in Adaiyah formation when compared with other formations in the same well.
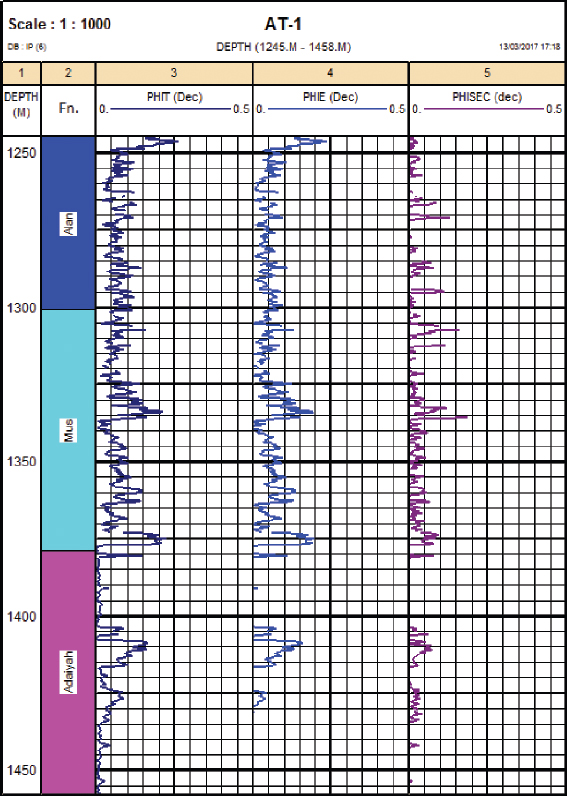
Figure 6. Porosity variation with depth at well Atrush-1. *PHIT (Total Porosity), PHIE (Effective Porosity), PHISEC (Secondary Porosity)
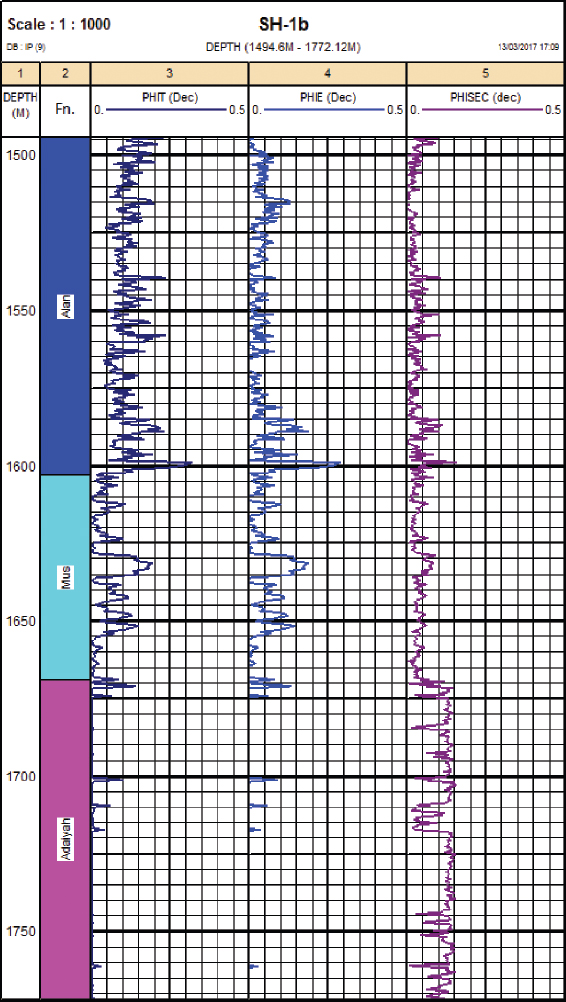
Figure 7. Porosity variation with depth at well SH-1B. *PHIT (Total Porosity), PHIE (Effective Porosity), PHISEC (Secondary Porosity)
4.4. Saturation Calculation
Water saturation (Sw) is the percentage of pore volume in a rock occupied by formation water (Asquith and Gibson, 1982). The water saturation (Sw) of reservoir in an uninvaded zone is calculated by Archie’s Equation (6) (1942), which is expressed as follows:
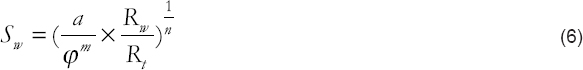
Rw is formation water resistivity at formation temperature; Rt is true formation resistivity; a is the tortuosity factor = 1.0;m is the cementation exponent, normally equal to (2.0); n is the saturation exponent, normally equal to (2.0).
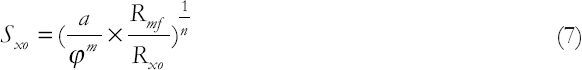
The water saturation of formations in flushed zone (Sxo) is also calculated by the Archie Equation (7). Mud filtrate resistivity (Rmf) is used instead of formation water resistivity (Rw), and uninvaded zone resistivity (Rt) is replaced by flushed zone resistivity (Rxo). Hence, regarding a flushed zone, the Equation (7) takes the following form:
Hydrocarbon saturation (Sh) is the remaining pore volume in a rock occupied by hydrocarbon, and it can be determined using water saturation data through this Equation (8):

The saturation in the flushed zone can be used to estimate the residual oil saturation (Sor) and the movable hydrocarbon saturation (Shr) using the following Equation (9) and Equation (10):


The results of fluid saturation are shown in Figures 8 and 9.
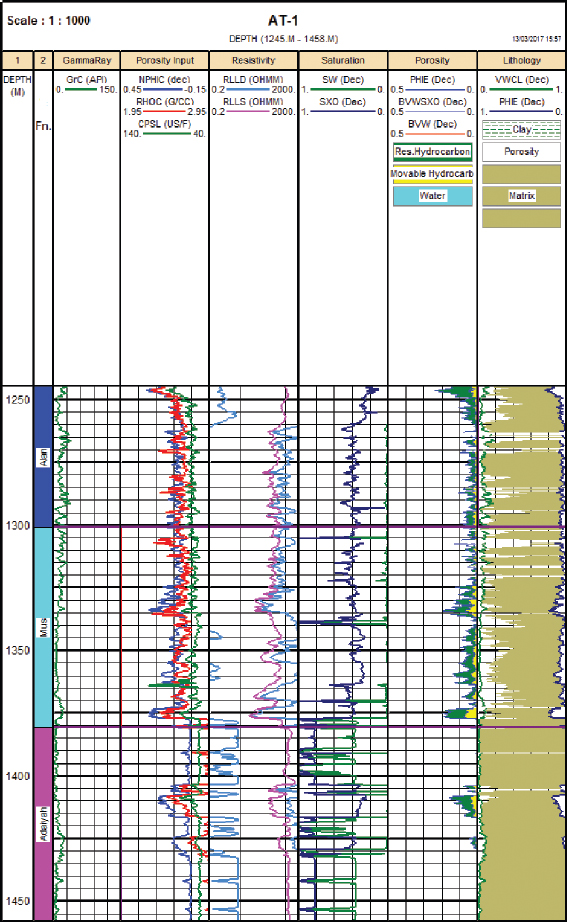
Figure 8. Computer processed interpretation for well Atrush-1
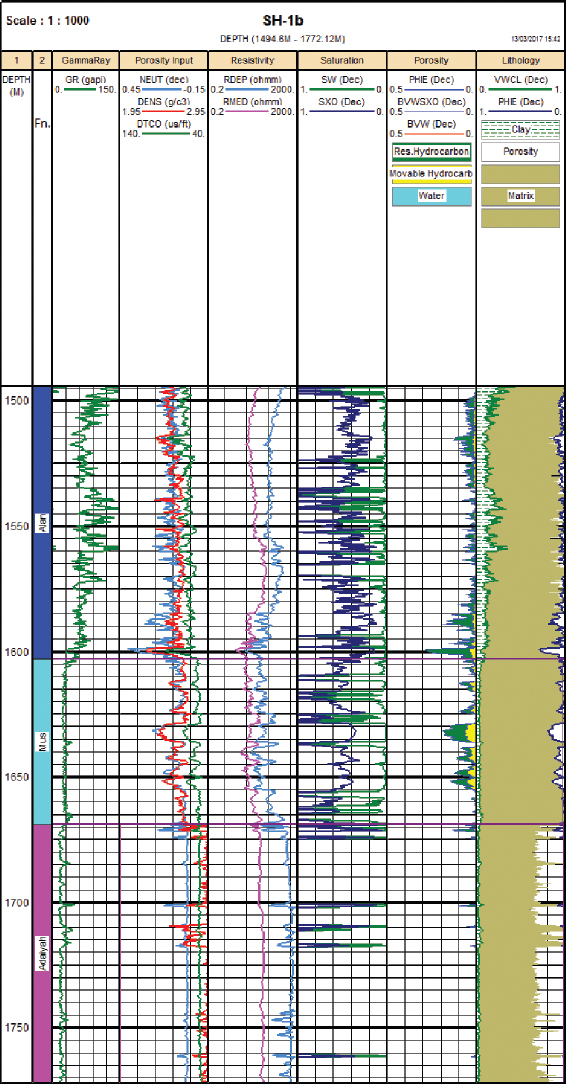
Figure 9. Computer processed interpretation for well Shaikhan-1B
4.5. Bulk Volume of Water (BVW)
The product of a formation’s water saturation (Sw) and its porosity (φ) is the BVW (Asquith and Gibson, 1982). The BVW in the uninvaded and invaded zones is calculated using the Schlumberger (1989) Equation (11) and Equation (12), respectively:


The area between BVWsxo and BVW represents the movable hydrocarbon, the area between BVWsxo and φe represents the residual hydrocarbon, while the area between φe and BVW represents the total hydrocarbon.
Figures 8 and 9 show the relationship of these variables (Sw, Sxo, Sor, Shr, BVW, and BVWsxo), with the depths of the wells. As shown in these figures, which represent CPI, hydrocarbons are detected in the Alan and Mus formations in wells AT-1 and SH-1B. However, the Adaiyah formation, due to dominant Anhydrite lithology, may represent a seal for the older Butmah formation. Movable hydrocarbon, observed in two wells, is approximately equal to the residual hydrocarbon. In some places, it is less than residual hydrocarbon, which means that permeability values range from low to medium in these formations.
5. CONCLUSIONS
The log-based study of reservoir characters of some Jurassic formations yielded several conclusions:
-
The neutron-density cross-plot used for lithology determination revealed that dominant lithology for Alan and Mus formations is limestone in wells AT-1 and SH-1B. The Adaiyah formation is composed of anhydrite, calcareous dolomite, and dolomite in well AT-1. In well SH-1B, that formation consisted of anhydrite, limestone, and dolomite.
-
The volume of clay, calculated from GR log, in well AT-1, showed low concentration in the Alan, Mus, and Adaiyah formations. At well SH-1B, the concentration of clay was very low in Mus and Adaiyah, with a slight increase up to 10–20% in the Alan Formation.
-
Porosity is calculated using the porosity logs. The porosity of the Alan and Mus Formations, in both wells AT-1 and SH-1B, ranges between 0 and 20%, which indicates good reservoir quality. Accordingly, Alan and Mus formation can make a good zone for preservation and accumulation of hydrocarbons. The Adaiyah Formation, in well AT-1, has porosity ranging between 0 and 7%, which is attributed to present calcareous dolomite and dolomite. Therefore, hydrocarbons can be preserved in some units of this formation, but in general, this formation is considered as a seal for hydrocarbon accumulation at well SH-1B, as porosity range is decreased down to 0–3%. As this is a very low value, the formation can be considered a seal for Butmah formation.
-
Water saturation, an important parameter in reservoir characterization, can be determined by resistivity logs. The values of average water saturation were low in the Alan and Mus formations in both wells, indicating good hydrocarbon saturation. While the average water saturation of the Adaiyah formation in well SH-1B is very high, depriving its ability for hydrocarbon saturation. In well AT-1, the same formation displayed high average water saturation, leading to low hydrocarbon saturation.