1. INTRODUCTION
Optimization of the drilling parameters has been the core of research for many researchers operating in drilling industry. The optimized rates have great positive impact on wellbore stability, reduce whole problems, reduce in overall drilling cost, and maximize the production of the well. The drilling parameters we refer come under combination of both mechanical and hydraulic energies, and they include the optimum hydraulics (drilling fluid type, density, and discharge), rotation and the weight on the bit to achieve optimum efficiency, and finally, the selection of the suitable type of bit which is the core of this study which will all eventually result in having best rate of penetration (ROP). Drilling operations have been active in Kurdistan over more than a decade, and many operators have been drilling wild cats and exploring different formations with different formation properties and pressures. In these operations, the operators have depended on offset well data in understanding the formation behavior and made use of this data in setting off their drilling parameters and in selecting proper bits and bit nozzle diameters. The selection of proper bits that match the correct type of formation and the use of optimum hydraulic and mechanical parameters to have maximum drilling footage and preserve well bore structure has been a field of research and suggestion for many bit selling service providers as well companies involved in drilling services in general. The available well data are sufficient to process through method developed and tested by Simmons in 1986 and will be used for computation and mechanical analysis, which includes: Mechanical loading (WN), weight on bit (WOB), bit rotation, bit running time, and footage drilled, and hydraulic analysis, which includes: Total mechanical energy, bit and pump hydraulic horsepower, discharge and flow velocity, and proposed bit nozzle diameter.
Data of three wells from Kurdistan have been used in this study, and new drilling parameters have been proposed in two different scenarios for future drilling. The available literature on this field of the study works on drilling optimization and bit selection, and the scientific and technical methods applied for optimization from the early days of drilling industry startup, up to date. The development of rotary drilling passed through a number of periods, starting with the concept period 1900–1920, development period 1920–1948, then the scientific period 1948–1968, and then the automation period which began in 1968 (Lummus, 1970). This has been followed by usage of advanced mathematics of multiple regression approach in optimization of parameters by Bourgoyne and Young (1974) followed by the real-time drilling optimization at the rig site by Simons for Chevron in 1986, and creation of real-time data transfer support centers in 2006, and up to date advancements in the technology (Eren, 2010). One of the prominent studies on having best constant weight and rotary speed resulting in the lowest drilling cost for roller cutter rock bits was made by Galle and Woods (1963). They presented graphs and charts for various formations for field applications to determine best WOB and rotary speed combination. They also developed a relation for the bit wear as a time function in relation to inverse ratio of bit weight to bit diameter. They developed an equation for calculating the tooth wear rate and rotary speed for mill tooth bits made for soft formation. Their graphs allowed for the calculation of footage, drilling cost, drilling hours, and conditions of the bearing and teeth of the dull bit. Galle and Woods (1963). A follow-up study is made by Bourgoyne and Young (1974), where they developed technique that is still the basis for many computerized scientific researches. They performed multiple regression analysis on a linear penetration rate model to optimize for the WOB, rotary speed, and bit hydraulics and also calculate formation pressure from drilling data. Parameters included as variables in their study were the strength of the formation, depth, compaction of the formation, bottom hole pressure differential, diameter of bit, WOB, rotary speed, wearing of bit, and the bit hydraulics. Their equation included 8 constants a1, a2…a8, those were determined using data of multiple wells. They found that regression analysis could be used to systematically evaluate constants in penetration rate equation and that the use of the equation can result in major drilling cost reduction. For this study, a method developed by Simmons (1986) is used for analysis. Simmons is one of the first researchers conducting studies on real-time optimization. He developed a technique for synergistically coupling drilling parameters, which included the optimum hydraulics, bit rotation, and WOB to optimize for drilling. The drillability of the formation and selection of the bit type was also integrated with the generally accepted drilling rate equation. The technique provided the engineer and the well planner to optimize the drilling parameters based on data received from offset wells, and it also allowed the drilling supervisor to “fine tune” drilling parameters to optimize for the drilling performance. This method is used for analysis in this paper due to its easy to use formulas because it gives indicative measures for the end users in the field. It is to be understood that, in today’s scientific advancement, software development is of high market value. Sawh and Solomon (2016) produced a software and introduced it to the market. The software monitors and optimizes drilling performance in real-time, enabling early detection of invisible lost time and non-productive time, ultimately saving rig time and reducing cost. The software allows for a smart approach to reduce inefficiencies while drilling a well by the innovative approach of benchmarking and monitoring. The system accounts for up to 39 KPI’s, such as ROP, on and off bottom time, and circulating and connection time determination. The researchers conclude that their research together with breakthrough human thinking reveals the potential for saving in overall operating performance. Drilling tool producing firms are also making developments in this aspect, and Drillbit Optimization System (2016) is today’s presented technology by Schlumberger for drill bit selection and optimization. The system uses offset well data to broaden the understanding of subsurface environment, drilling application, and potential performance. Understanding and analysis of this data will lead to optimize the well placement and give ultimate production, in planning before drilling the well. The system comprises well logs, mud logs, formation tops, mechanics of rocks and rock specifications, core analysis, bit record, real-time drilling parameters, conditions of the dull grading, and survey data for more than 30000 wells around the globe.
2. PROPOSED THEORY FOR ANALYSIS
First step: Offset bit evaluation and mechanical calculations for newly planned well:
1. Calculating the average WN number for the bit run [Equation 1]:

2. Calculating weigh on bit exponent (d) [Equation 2]:
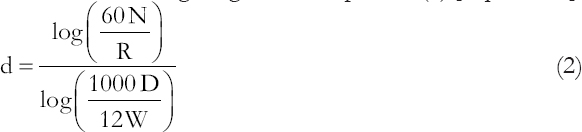
Where N is the RPM, R is the ROP, D is the bit diameter without deduction as it is a PDC bit, and W is the weight on bit WOB.
3. Calculating the bit constant (K) [Equation 3]:

Where (H) is the working hours
4. Determining the optimum WN number [Equation 4]:

To have a more accurate and practically safe approach to the WN value calculation, the researcher reviewed the existing bit specification sheet. The sheet provides an open range of bit loading from minimum value to 49000 lbs., at revolutions applicable for rotary and positive displacement motor. Taking that into account, a maximum value of revolution per minute (RPM) is estimated at 250 RPM at lowest bit weight. Using step 1, a linear interpolation relationship between bit weight and bit rotation is developed seeking optimum value of WN as per Table 1.
Table 1: WN value through linear interpolation for bit weight and bit rotation
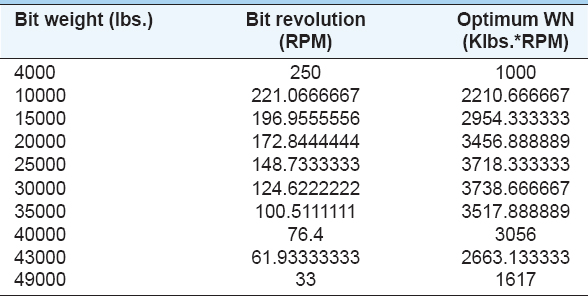
Moreover, in this case, the highest reachable WN value is 3738, using a 30000lbs WOB and 124.6 RPM. To facilitate for the calculations, weight is taken as 30000lbs and the RPM taken as 124 RPM, giving a WN value of 3720.
5. Projecting the planned bit performance
In this section, a correction is made on the calculated “d” exponent, which in turm will be used in the selection of the new bit for future drilling. This approach has been implemented using Table 2, and by inserting the corrected “d” value (dc) and bit size, will give you the IADC code for the journal bearing bits to be used in future drilling [Equation 5]:
Table 2: Journal bearing bit selection using dc value (Simmons, 1986)
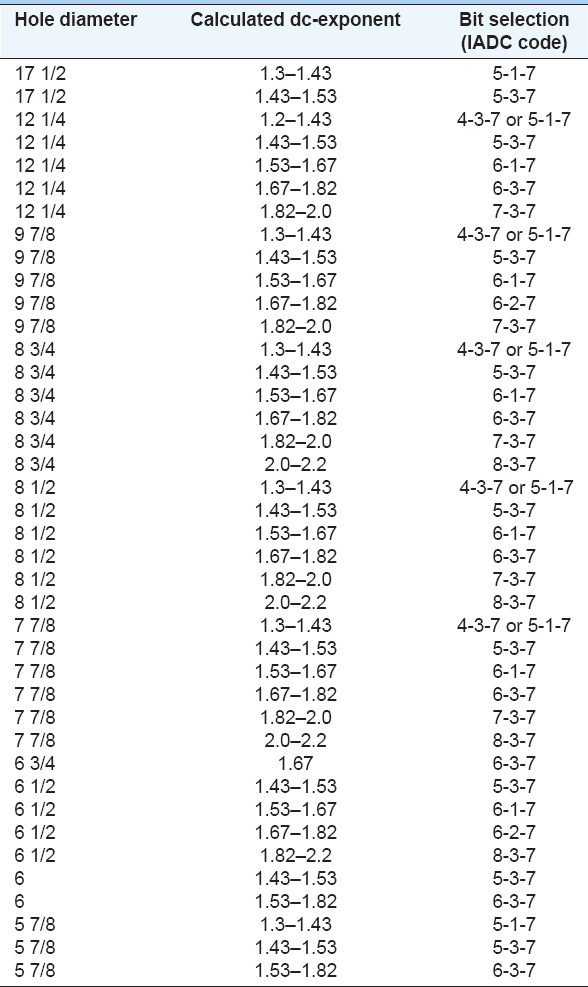
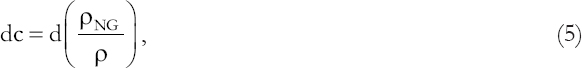
Where dc, is the corrected (d) value.
rNGis the mud density equal to the normal formation pore pressure gradient in ppg.
r is the mud weight in ppg.
For this calculation:
ρNG is calculated considering pore pressures depending on the salinity of the formation, for the fresh water, the pressure gradient is 0.433 psi/ft which leads to Equation 6:

For saline water with 100,000 ppm dissolved solids, the pressure gradient is 0.465 psi/ft, making the [Equation 7]:

This is considered by Schlumberger (2017) as a normal pressure gradient. It is also to be noted that, for an extreme high gradient, mud weights of 18 ppg or higher are needed.
Looking into the data for the drilled wells, it is clear that mud weights used in drilling the study intervals are in the range of 8.5 ppg and 10 ppg, this clears to the fact that no abnormal pressures were noticed and a ρNG of 9 ppg is justifiable to be taken for the 17.5″ Section, and as we go deeper, the value is to be raised to 9.2 ppg, 9.5 ppg, and 10 pgg for the 12 1/4″ Section.
6. WOB estimation
Loading the bit with 4000–7000 lbs/inch of bit diameter. The value depends on rock matrix and type of bit being used, an IADC series “8” could be loaded with 7000, while IADC series “4” or “5” is to be loaded at 4000 lbs/inch of bit diameter. In the second scenario, the bit is loaded with the interpolation value that gives highest WN value.
7. Calculating the new value for the bit rotation
This value is the ratio of optimum WN to optimum WOB. In this study, the researcher has followed two methods for optimum WN calculation, both values will be used from this point forward, and the value that leads to an overall higher drilling performance will be selected for design purpose [Equation 8]:
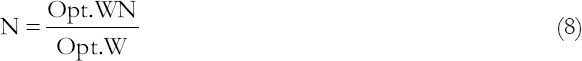
Where: N− is the bit rotation in revolution per minute (RPM)
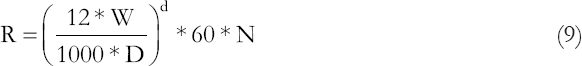
8. Projecting the new rate of penetration (R) [Equation 9]:
9. Calculating the bit running time [Equation 10]:
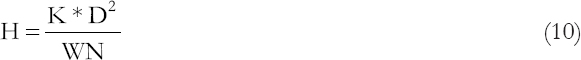
Where H is the running time in hours.
10. Calculating the total footage drilled in all scenarios [Equation 11]:

Second step: Coupling mechanical energy with hydraulic energy:
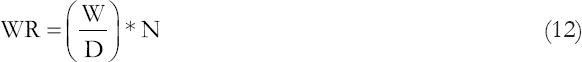
11. Calculating the total mechanical energy (WR) [Equation 12]:
12. Determining the bit hydraulic horse power (BHHP) [Figure 1] Equation 13:
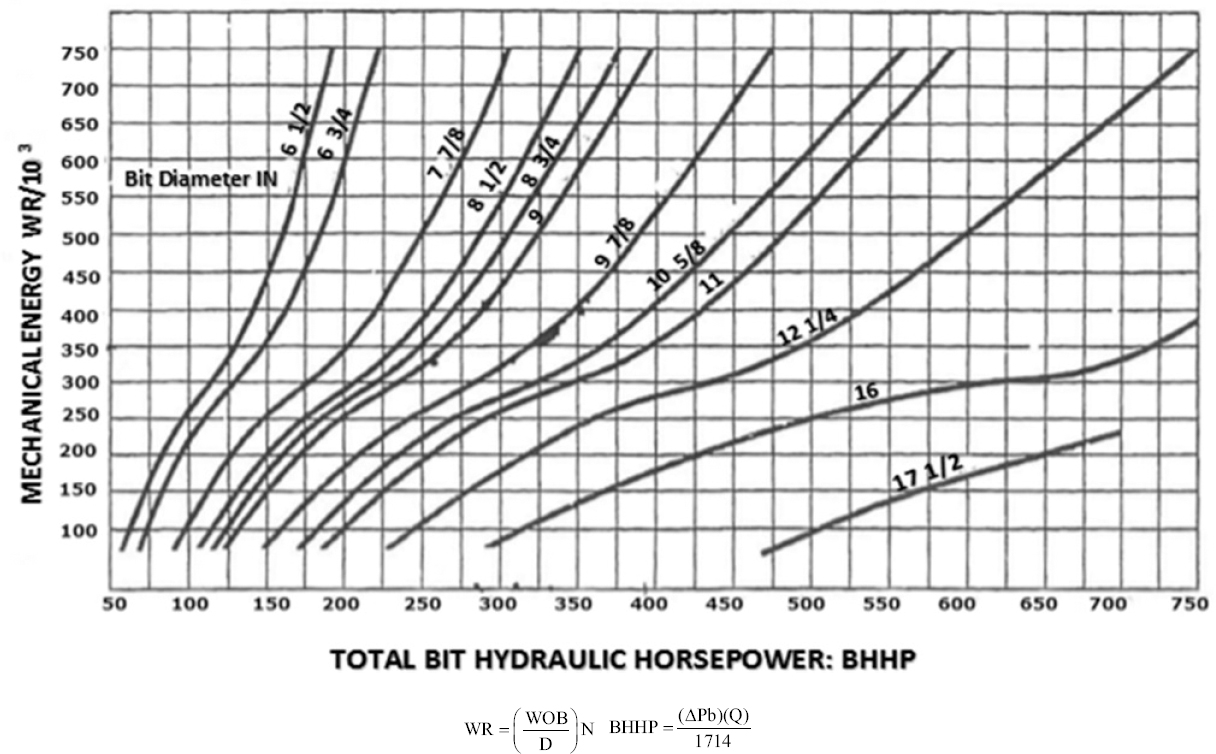
Figure 1. Mechanical energy versus required bit hydraulic horsepower (Simmons, 1986)
13.
(i.e., WR*103) with WR value on the y-axis:
14. Determining the pump hydraulic horsepower (PHHP) [Equation 14]:
15. The next step is to calculate the discharge and the annular flow velocity [Equation 15]:
Where Qr is the discharge in gal/min.
∆Pm: thMaximum allowable surface pressure.
16. Calculating the required drill bit nozzle size for the given ∆Pm [Equation 16]:
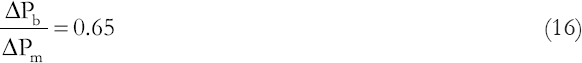
Where ∆Pb is the bit pressure loss [Equation 17]:
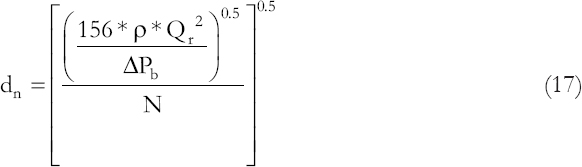
Where dn is the required nozzle diameter, and N is the number of nozzles in the selected bit.
3. REPRESENTATION OF RESULTS FOR THE SUBJECT BLOCK OF THE STUDY
The selected research theory has been applied to data of a field in Kurdistan/Iraq, on three of the wells drilled (W1, W2, and W3), assessing the performance of each run and comparing the actual performance to two sets of suggested parameters. Bits used were: 17 1/2″ HDBS, PDC, Type FXE75H on W1 (Bit 1); 17 1/2″, Smith, GSi12BVE on W1 and W3 (Bit 2); 17 1/2″, HDBS, EBXT02SLC on W1 (Bit 3); 17 1/2″, Ulterra, U616S PDC on W1 (Bit 4); 17 1/2″, Smith, SDI616MHBPX PDC on W2 (Bit 5); 7 1/2″, Ulterra, U616SPDC on W2 (Bit 6); again 17 1/2″, Smith, SDI616MHBPX on W3 (Bit 7); 12 1/4″ HDBS, type FX65DMH, PDC on W1 (Bit 8); 12 1/4″ Ulterra, type U616M-BC, PDC on W1 (Bit 9); 12 1/4″ Smith, type MSiZ616, PDC on W2 (Bit 10); 12 1/4″ Ulterra, type U616M, PDC on W2 (Bit 11); 12 1/4″ HDBS, type MM75DR, IADC M323, PDC on W3 (Bit 12); and 12 1/4″ HDBS, type MM65DMH, PDC on W3 (Bit 13). Calculations of the 12 1/4″ Section are presented, and for the 17 1/2″ Section, only results are presented in the analysis as per Tables 3-5.
Table 3: Calculations of the 12 1/4l, bit mechanical analysis
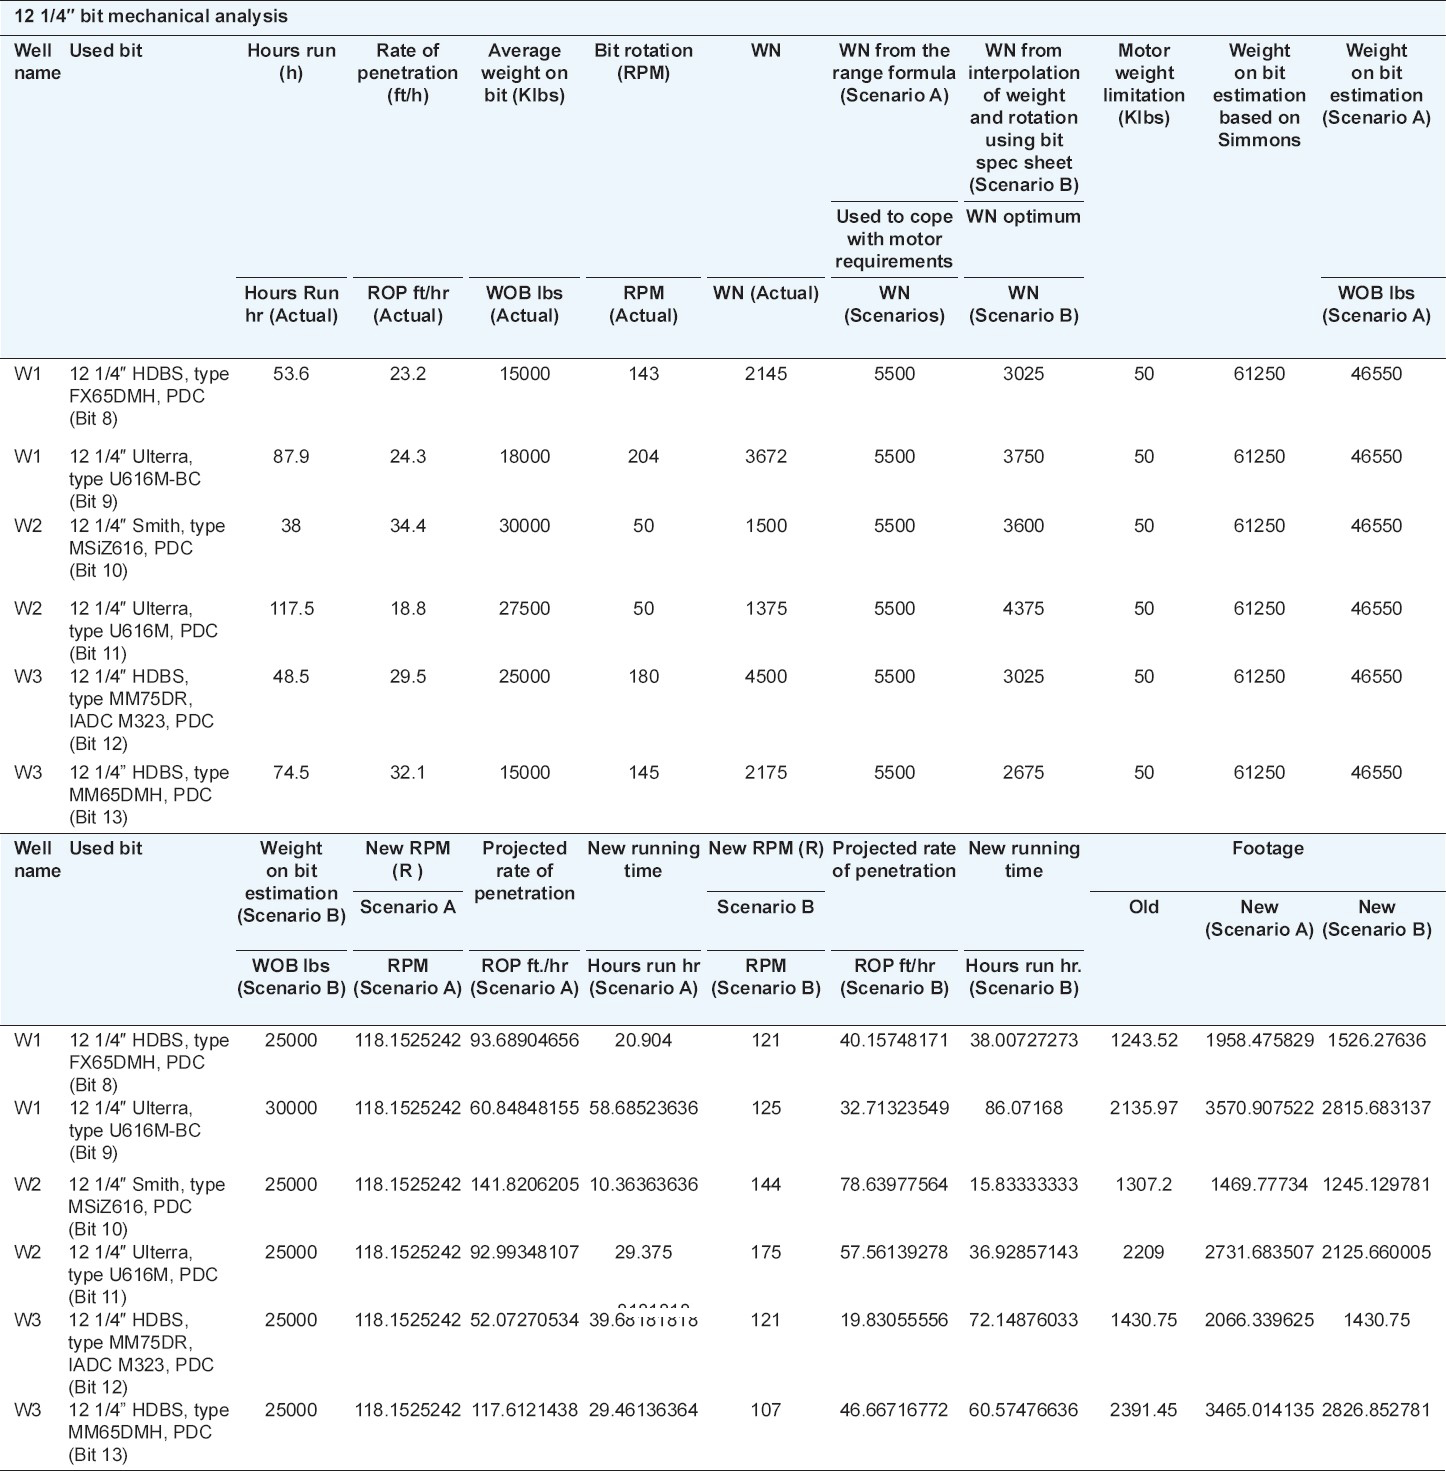
Table 4: Calculations of the 12 1/4″, bit hydraulic analysis
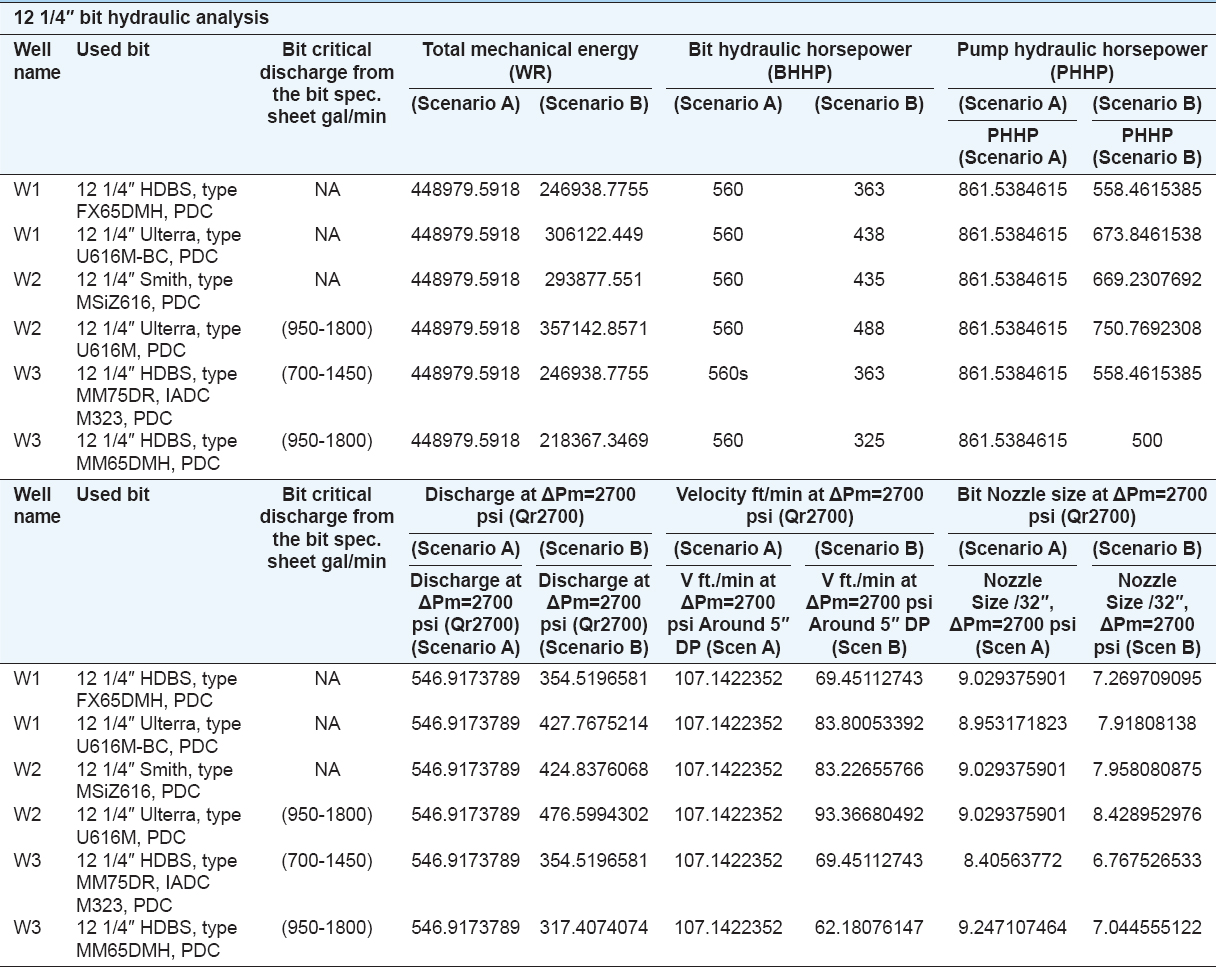
Table 5: Final analysis
4. ANALYSIS AND DISCUSSION OF THE RESULTS
4.1. The Value of WN
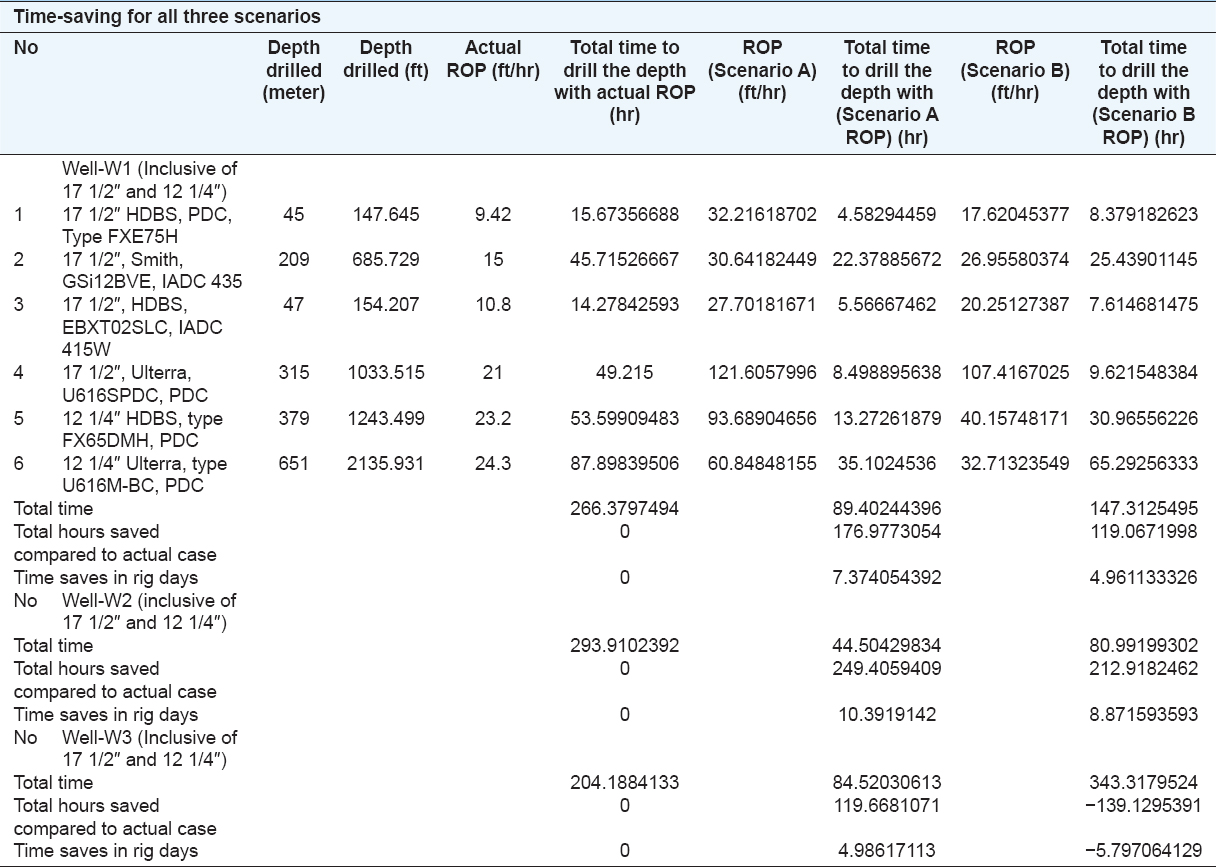
For 17 1/2″ Section [Figure 2]: For the three calculated WNs, we observe that in all scenarios, and for all the bit, the value of the actual WN is smaller in all cases than the value calculated from parameter suggestions made by Simmons (Scenario A) and is also smaller than values calculated from the interpolation of weight and rotation limits obtained from the bit specification sheet (Scenario B) except for the last bit (17 1/2″, Smith, SDI616MHBPX, and Serial No. DS0470, PDC) used on CK-8, where the maximum value of the WN obtained from interpolation is less than actual applied in the field, this is an indication stating that the bit in the field was load and rotated at values above the limit values of obtained from interpolation, but yet lower than limit values accepted using Simmons method. In case of Scenario A and as noticed, the WN value from the range formula is between 9118 and 10588, yet the researcher is using a value as high as 6700 to cope with motor weight limitations and surface equipment hydraulics and horsepower requirements sufficient enough to provide sufficient hole cleaning and also to comply with table provided for mechanical energy versus hydraulic horsepower table used in calculations by Simmons. In general, we observe a conservative approach followed by the driller in the field in the actual scenario using lower weight and bit rotation leading to low WN value, followed by a less conservative approach obtained from Scenario B as most of these bits are PDC and are dependent on shear cutting capacity of the bit rather than weight application, and finally, the least conservative being the model provided by Simmons which gives the highest WN value.
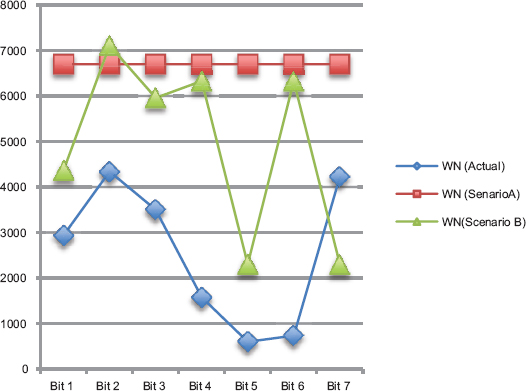
Figure 2. WN for 17 1/2²Section
For 12 1/4″ Section [Figure 3]: Same as the 17 1/2″ Section, we observe a conservative approach from the drillers in loading and rotating bit, which has resulted in lower actual WN value. The actual WN in all scenarios is less than value suggested by Simmons (Scenario A) and is also less than values calculated from interpolation of weight and rotation limit obtained from bit specification sheet (Scenario B) except for bit (12 1/4″ HDBS, type MM75DR, IADC M323, PDC, Serial 12302468) used on CK-8 well, where the actual applied value of WN is more than interpolation value. Moreover, this indicates the fact that the bit was loaded and rotated in the field with values higher than values obtained from interpolation of parameters on bit specification sheet. In case of Scenario A, we notice that the WN value from the range formula is between 6029 and 7500, yet the researcher of this paper is recommending to use 5500. This is due to the usage of motor and motor weight limitation; however, if there was no motor used, the used value of 5500 is less than minimum value and this causes insufficient loading which might lead to bit jumping phenomena. Moreover, again as 17 1/2″ Section, we notice that bits used are PDC which mostly depend on the sheer cutting capacity of the bit and less or non-dependent on hammering action. And, this leads to lower WN values while interpolating the weight and rotation parameters from the bit specification sheet than what we obtain from the method used by Simmons which terms to be least conservative when it comes to weight application.
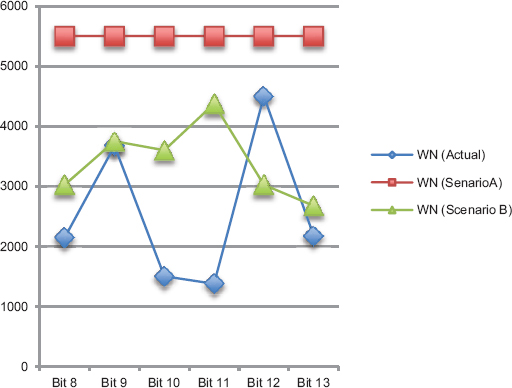
Figure 3. WN for 12 1/4²Section
4.2. WOB
For 17 1/2″ Section [Figure 4], we observe that the majority of the bits are PDC type with only second and third from the 17 1/2″ bit list being Tri-cone inserts. With this type of bits, the main performance comes through the shear action and bit rotation rather than applying more WOB to hammer the rock, which is the case with the Tri-cones. When it comes to the weight application, we observe that the driller had a conservative approach to the field application and weights applied to all bits except for the last bit. Weight applied to the bits is less than weight calculated using Simmon’s approach for medium to hard formations, which in all cases, the writer of this papers considers as 5000 lb./inch of diameter equaling 87500 lb./bit. However, the value used for the case of Simmons approach is less and is 52500 lb./bit (Scenario A), this is to cope with the motor weight limitation as well as the rig hydraulics, as excessive weight will generate more cuttings those require good carrying capacity and flow velocity to bring the cuttings to the surface which eventually require higher bit hydraulic horsepower and pump hydraulic horsepower. If we consider Scenario B, we observe that weight limitation from the interpolation of parameters is in all cases higher than actual field value except for the case of 17 1/2″, Smith, SDI616MHBPX, Serial No. DS0470, PDC used on CK-8, whereby actual applied weight is more than interpolation value. Yet, weight applied in (Scenario B) in all cases is less than weight applied in Scenario A as the specification sheet value provided is an indication for the fact that bits used are more dependent bit shear strength than the hammering and weight application of the tri-cones as is the case in Simmons method.
Figure 4. Weight on bit 17 1/5²Section
For 12 1/4″ Section [Figure 5], all bits used are PDC, with main factor for bit performance to be the shear cutting capacity of the bit. Weight recommend in Scenario A is always more than the value suggested in Scenario B and the actual value applied in the field. However, we observe that the bit in the two cases of 12 1/4″ Smith, type MSiZ616, PDC, Serial JG4129 on CK-6, and 12 1/4″ Ulterra, type U616M, PDC, Serial 25174 on CK-6 have actual weight applied more than the value obtained from the interpolation formula. The value calculated using Simmons by applying 5000 lb/inch of diameter for moderate to hard formation sums to 61250 lb/bit which is more than maximum value that an 8″ motor withstands which is mostly used on 12 1/4″ bit BHAs that is limited to a maximum of 50000 lb/bit according the Schlumberger specification sheet. Therefore, a value of 46550 lb/bit is used for Scenario A, and Scenario B uses values obtained from interpolation of bit specification sheet.
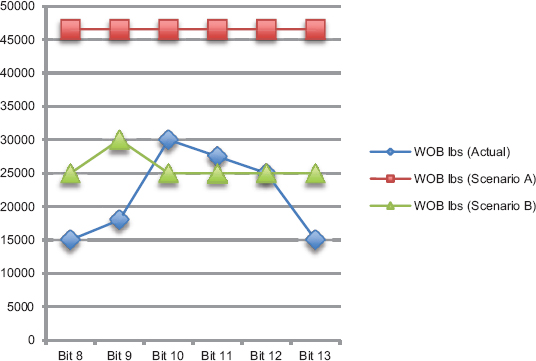
Figure 5. Weight on bit 12 1/4²Section
4.3. RPM
17 1/2″ Section [Figure 6]: For all the used bits, we observe that the actual bit rotation is less than the one suggested in Scenario A except for the 17 1/2″, Smith, SDI616MHBPX, Serial No. DS0470, PDC where the value is higher, and in all cases, the value suggested by interpolation is always more than the actual applied in the field as well as the value calculated from Simmons formula in Scenario A. This clears the indication that Simmons is more dependent on weight application and bit specification sheet provide for more shear strength and rotation in performance rather than weight application.
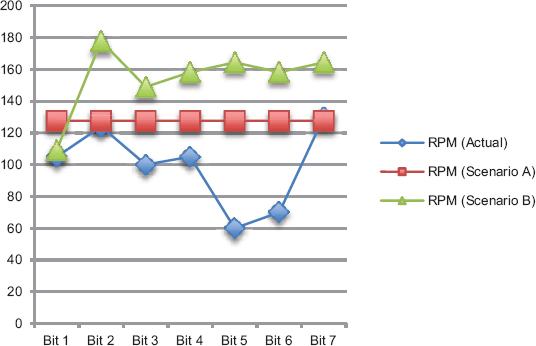
Figure 6. Revolution per minute for the 17 1/2² Section
12 1/4″ Section [Figure 7]: There is a mixed arrangement for all the bits and for all the three scenarios, in general, wherever the weight is higher, the bit is being rotated slower to preserve the bit safety and extend its life; however, a total arrangement between weight and rotation is the applicable factor in obtaining a higher WN which is the main source for having a better penetration rate that will be discussed next.
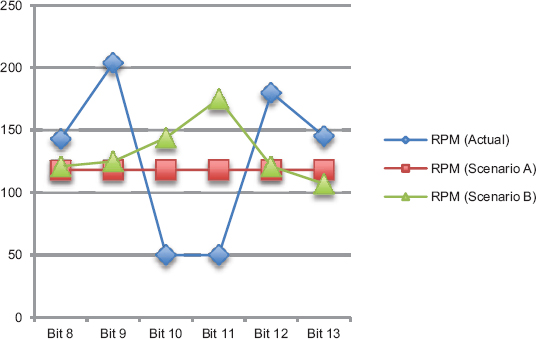
Figure 7. Revolution per minute for the 12 1/4² Section
4.4. ROP
17 1/2″ Section [Figure 8]: Parameters used for drilling provide an ROP for the Scenario A that supersedes the actual field value as well as values suggested in Scenario B. Scenario B exceeds the actual values in all cases except for the case of 17 1/2″, Smith, SDI616MHBPX, and Serial No. DS0470, PDC used on CK-8 and is always less than Scenario A values. The case of 17 1/2″, Smith, SDI616MHBPX, Serial No. DS0470, PDC is an indication that drilling parameters suggested in Scenario B are less efficient than the actual ones already used in the field, and therefore, giving lower value ROP.
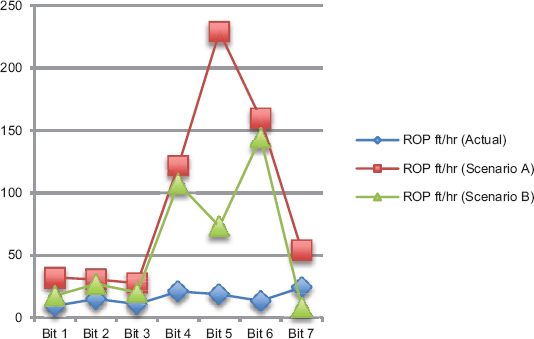
Figure 8. Rate of penetration of the 17 1/2² Section
12 1/4″ Section [Figure 9]: ROP values calculated in Scenario A is always more than the actual applied in the field as well as the values calculated from the interpolation of parameters in Scenario B, this indicates that Scenario A values are an improvement to the overall performance. Scenario B values are an improvement to the actual values in all cases except for the case of 12 1/4″ HDBS, type MM75DR, IADC M323, PDC, Serial 12302468 on CK-8 well, and this makes Scenario B values for this case less efficient than actual applied in the field. Moreover, the main reason for that is the actual WN from the field is more than the one calculated from the production of interpolation values of weight and rotation in Scenario B. Higher value WN gives room for higher value drilling parameters, and in turn, better penetration rate.
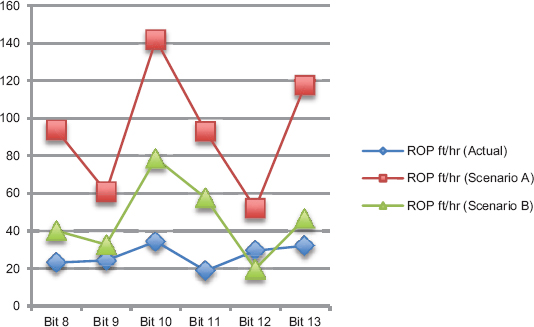
Figure 9. Rate of penetration of the 12 1/4² Section
4.5. Working Hours and Time Save in Days
17 1/2″ Section [Figure 10]: It is clear from the graphs that the improved drilling parameters have resulted in better ROP and eventually shorter drilling time, thereby improving efficiency. From the results, we observe that the actual time is the longest, followed by time from Scenario A and Scenario B having shorter time intervals due to their improved parameters, except for the case of 17 1/2″, Smith, SDI616MHBPX, Serial No. DS0470, PDC and in Scenario B has less performing drilling parameters and therefore taking longer time in drilling performance. Coming to the conclusion, the higher the drilling parameters, the shorter the drilling interval time.
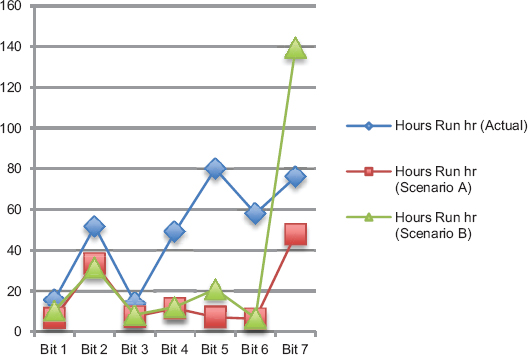
Figure 10. Working hours 17 1/5² Section
12 1/4″ Section [Figure 11]: Same as the previews section, the longest time is the actual followed by mainly by time from the Scenario B due to its more conservative drilling parameters, followed by Scenario A having the highest value of drilling parameters, being valid for all the cases except the case of 12 1/4″ HDBS, type MM75DR, IADC M323, PDC, Serial 12302468 used on CK-8 in the case of Scenario B has longer time span than both other scenarios, and this is because the applicable parameters are lower in value, resulting in longer drilling time to drill the interval.
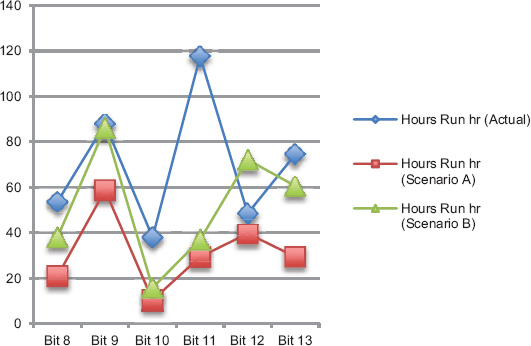
Figure 11. Working hours 12 1/4² Section
With regard to time-saving [Figure 12]:
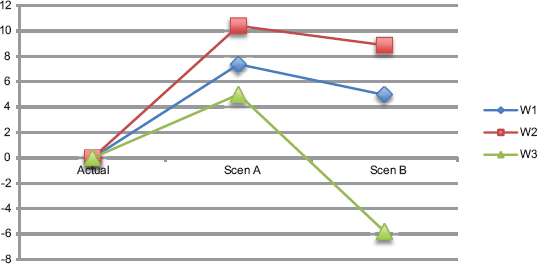
Figure 12. Time save for the three wells
W1: The overall time save for the entire well drilling is 7.4 rig days using parameters from Scenario A and is almost 5 rig days using the more conservative approach of Scenario B.
W2: The overall time save for the entire well drilling is 10.4 rig days using parameters from Scenario A and is almost 8.9 rig days using the more conservative approach of Scenario B.
W3: The overall time save for the entire well drilling is almost 5 rig days using parameters from Scenario A and is in negative value while using drilling parameters from Scenario B, this is an indication that actual values used in drilling were higher than the ones suggested using Scenario B suggested values.
4.6. PHHP
17 1/2″ Section [Figure 13]: The drilling parameters in this section have been suggested and designed in a way so that the required bit hydraulic horsepower not to exceed 900 hp. The bit hydraulics for this section that have been suggested in Scenario A are as high as 900 hp, leading to a PHHP of 1385 hp which could be supplied by a single pump considering the pump capacity to be 1600 hp, so the supply of one pump as primary and a second one as a backup should be sufficient for this operation, knowing that initial wells were drilled using three pumps, and this shows the excessiveness in number of pumps, and that future wells could be drilled saving one pump rental cost. The horsepower requirement for Scenario B is either equal or less than that of Scenario A having lower drilling parameters, therefore requiring less horsepower for the provision of circulating velocity, hole cleanup, and cutting removal to the surface.
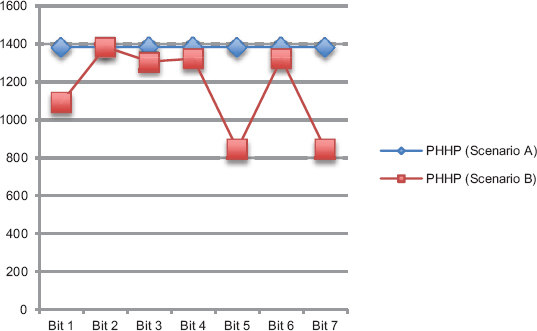
Figure 13. Pump hydraulic horsepower for 17 1/2²Section
12 1/4″ Section [Figure 14]: The required bit hydraulics for this section are as high as 560 hp (Scenario A) leading to a PHHP of 862 hp being the maximum scenario. In Scenario B, the required PHHP is less than Scenario A due to its lower drilling parameters requiring less horsepower to maintain the hole cleanup and cutting removals potential.
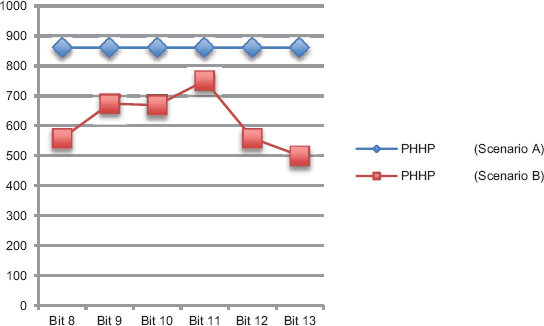
Figure 14. Pump hydraulic horsepower 12 1/4²Section
4.7. Velocity (ft./min)
17 1/2″ Section [Figure 15]: For all surface pressure cases and for the Scenarios A and B, the velocity has been calculated around the BHA drill collars and normal drill pipes. The drill collars for the 17 1/2″ bit are considered to be 9 1/2″ referencing common BHA presented by Schlumberger and the drill pipes to be normal 5″ drill pipes. Two graphical presentations have been made, one for the case of velocity around 9 1/5″ drill collar and the second for the velocity computation around the 5″ drill pipe. In the graph of the velocity around the 9 1/2″ Drill collar, we observe that, for the case of the 3500 psi surface pressure, the velocity of Scenario A is higher than Scenario B due to higher discharge value, and that values, in the case of 2700 psi surface pressure, are higher than the case of 3500 psi surface pressure, which again goes to the fact that discharge calculated from the 2700 psi surface pressure is higher than that of the 3500 psi surface pressure. The same applies for the case of around the drill pipe, except that the velocities become lower in value due to having larger flow area. The general accepted least flow velocity is as low as 50 ft/s, and as noticed in the case of 3500 psi surface pressure and in a few bit cases the velocity is falling to as low as 36 ft/min, whereas the values obtained from the case of 2700 psi surface pressure all come higher than 50 ft/min. Therefore, having the lower surface pressure case is recommended.
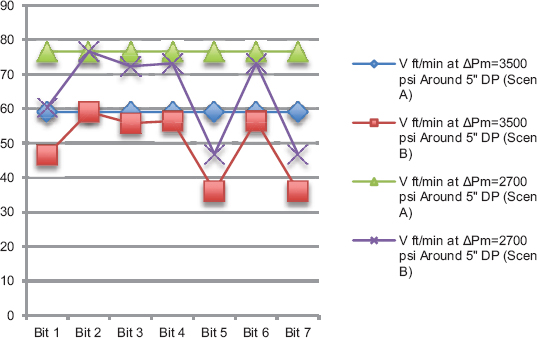
Figure 15. Velocity calculation for the 17 1/2² Section
12 1/4″ Section [Figure 16]: Same phenomena of the 17 1/2″ Section is applied to the 12 1/4″ Section with having all velocities higher in value due to higher bit hydraulics and smaller flow area.
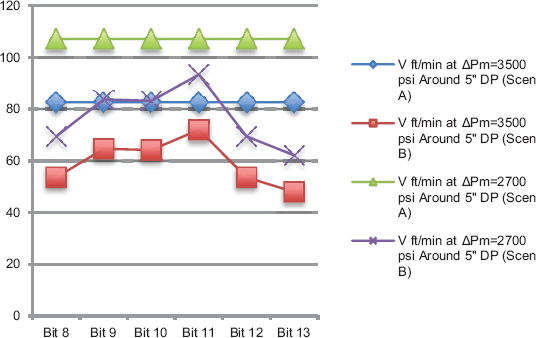
Figure 16. Velocity calculation for the 12 1/4² Section
4.8. Nozzle Diameter (32nd of an inch)
17 1/2″ Section [Figure 17]: For the case of surface pressure of 3500 psi, Scenario A has larger nozzle diameter than Scenario B reason being is that the discharge for Scenario A is higher than that of Scenario B. This is repeated for the case of surface pressure of 2700 psi except that the sizes of the nozzles for this case are becoming larger in both scenarios than the previews case of surface pressure 3500 psi.
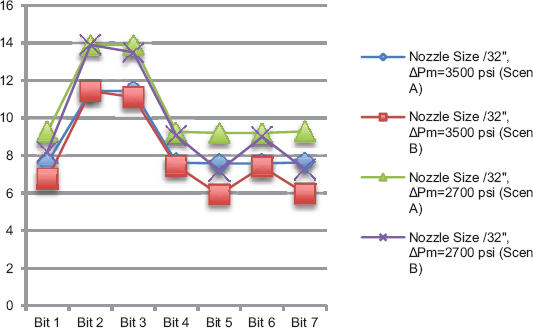
Figure 17. Nozzle diameter for the 17 1/5² Section
12 1/4″ Section [Figure 18]: Same phenomena of the 17 1/2″ Section is applied to the 12 1/4″ Section with having smaller nozzle diameters than the 17 1/2″ Section, reason being is higher discharge in the case of 17 1/2″.
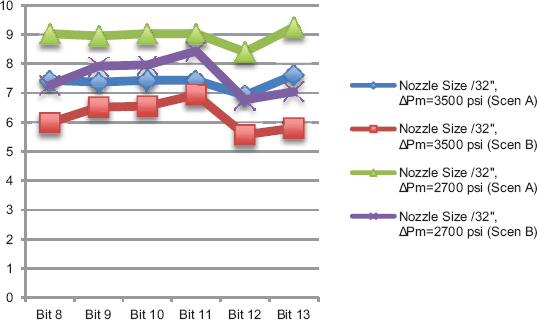
Figure 18. Nozzle diameter for the 12 1/4² Section
5. CONCLUSIONS
-
The selected method by Simmons 1986 analyzed the parameters with two scenarios. It is clear that using Simmons method will improve the ROP and provide for a major save in time. Using second scenario will also provide improved rates but not in all cases due to lower WN value obtained in some of the interpolations.
-
The mud density equal to the normal formation pore pressure gradient in ppg expected for the formation is a major factor in determining the IADC of the future selected bit, the higher the value, the higher IADC number needed in the future bit selected.
-
The scenario analysis shows that lower ∆Pm values would result in higher discharge, which in turn gives higher velocities and better well cleaning. Moreover, the higher PHHP, the higher the discharge, and the higher the velocity. As an overall, the study provides a successful technique and could be majorly considered in assessing the tools performance for better penetration rate.
-
The calculations also show that the needed hydraulic horsepower of the pump is a maximum of 1300 hp which is less than what is provided by one of the pumps used those provide 1600 hp. For that, future drilling should consider the usage of a single pump and a second at standby instead of having to pay for three pump rentals.
-
The research proves that, in most of the scenarios and cases, higher bit weight and rotation could be applied to the bits, resulting in better penetration rate than the original value. This is an element of confidence developed with better understanding of formation and bit performance.
-
The current data that the company has in hand are sufficient to understand the behavior of the formation. Statistics show the bit performance report and give sufficient assessment information those were used to recommend new parameters to give better ROP and better bit performance.
6. RECOMMENDATIONS
-
Method used is a practical mean for parameter optimization with a limited source of data available on bits and formation. Future drilling may suggest further sophisticated computerized techniques. The techniques will use logging tools that will deliver real-time data to the surface, connected to computerized system that could optimize through mathematical regression and suggest new parameters for the driller to drill with, more of what so-called Auto Drillers.
-
In-depth discussion of the work performed with senior experienced engineers brings us to the conclusion of: It is true that the suggested formulas and new parameters as well as the use of computer systems might suggest noticeable improvement in performance, but the human experience and knowledge will remain the most efficient factor in deciding for the most suitable decisions that will safeguard the drilling campaign as well as provide better performance.
7. NOMENCLATURE
d=Outside diameter of pipe, in.
D=The bit diameter, in.
dc=The corrected diameter, in.
dn=The required nozzle diameter, in.
H=The working hours, hrs.
N=The number of nozzles in the selected bit.
Qr=The discharge in, gal/min.
R=The rate of penetration, ROP.
W=The weight on bit (WOB).lb.
WN=Number for the bit run.
∆Pb=The bit pressure loss, psi.
∆=m=Maximum allowable surface pressure, psi.
r=the mud weight in ppg.
rNG=the mud density equal to the normal formation pore pressure gradient in ppg.