1. INTRODUCTION
Water is an important natural resource in the world, and it is the most essential element on the earth to maintain human life (Issa, 2017). Water physicochemical property is always a key factor for the assessment and evaluation of drinking water quality (Bhuiyan, et al., 2011). There are numerous chemical and physical parameters that can be included within the water quality assessment. Many guidelines have been proposed to evaluate the chemical and physical parameters of drinking water quality individually (World Health Organization, 2004).
Many attempts have been made to reduce the timescale for making decisions on the quality of drinking water and to have more general assessment processes which involve all concerned parameters. Water quality index (WQI) was developed to contain whole comparisons and evaluation procedures for a specific drinking water in one standard that represents the accurate status of the drinking water that is under investigation (Berisha and Goessler, 2013). First attempt to build such standard that called the WQI was done by Horton, 1965. Various water quality indices have been developed within a particular area which is used to evaluate different water systems: The US National Sanitation Foundation WQI (NSFWQI) (Hoseinzadeh, et al., 2015), Canadian Council of Ministers of the Environment WQI (Goher, et al., 2014; Hurley, et al., 2012; Magesh, et al., 2013), British Columbia WQI (Poonam, et al., 2013), and Universal WQI (Bharti and Katyal, 2011; Boyacioglu, 2007).
WQI represents a certain level of water quality while eliminating the subjective assessments of such quality, where it turns complex water quality data into information that is understandable and usable by the public (Simões, et al., 2008). Water quality for drinking water is a complex subject with multiple physical and chemical parameters and their interactions. Drinking WQI (DWQI) is a mathematical and statistical method to integrate and facilitate the complex water quality collected data into a numerical illustration for the general water quality status (Wang, et al., 2017). Significant progress has been done based on this principle of DWQI using slightly modified concepts (Ramesh, et al., 2010). DWQIs usually have ten or more water quality of physicochemical variables. The problem is that these variables have non-continuous data, therefore developing DWQI depending on fewer input data, and that can be used to compare sites that have water quality expectations (Said, et al., 2004). WQI is then used as a communication tool by environmental agencies to monitor specific water (Sadiq, et al., 2010). Numerous studies have been conducted to build DWQI for various regions in the world depending on the local physicochemical quality of drinking water of those regions (Krishan, et al., 2016; Oke, et al., 2017; Tiwari, et al., 2015; Wanda, et al., 2016).
Besides WQI, diverse statistical analysis techniques were performed on water quality data also either to interpret temporal and spatial variances or to determine the significance of tested parameters. Correlation matrix (CM) analysis is applied to determine the significant interrelations between the investigated water quality parameters, where these parameters may have a low or high effect on the quality (Abhishek and Khambete, 2013). A regression equation can be easily developed with the help of statistical analysis software depending on CM analysis (Heydari, et al., 2013). Multivariate statistical analysis is widely used in the analysis of water physicochemical data, and this technique is an effective tool for water quality evaluation (Aris, et al., 2015; Pejman, et al., 2009; Shrestha and Kazama, 2007; Tahri, et al., 2005).
Drinking water in Erbil City comes mainly from three drinking water treatment plants (DWTPs), namely, respectively: Efraz 1, Efraz 2, and Efraz 3. In addition to that, groundwater wells are used in some areas of the city. The source of raw water for the treatment of plants is the Greater Zab River. Various studies were performed to investigate the drinking water quality of Erbil City (Goran, 2010; Shareef and Muhamad, 2008). Bapeer, et al. (2006) studied, for the 1st time, some physicochemical variables and trace metal concentrations in treated water samples from two water treatment plants Efraz 1 and Efraz 2, and they found that water samples were fluctuated from safe and unsafe for drinking purposes. Ahmed and Ali, 2009, examined the chemical and radioactive levels of drinking water resources in Erbil City, and they concluded that no unusual concentrations were observed in the collected water samples all around the city. The seasonal variation in physicochemical properties in the Greater Zab River has been examined by Ali, 2010. He reported that dissolved and particulate trace metals in the Greater Zab River were fair and medium when compared to the adjacent Canadian and European standard for surface water quality, respectively. Kafia, et al. (2009) and Toma (2013) investigated various physicochemical parameters and traces of heavy metals such as Fe, Pb, Hg, Zn, Cd, Ni, and Cu, from the three water treatment plants on the Greater Zab River that provides drinking water to Erbil City, and they reached the same results of Bapeer, et al., 2006. Toma (2013) has also calculated the WQI for the three water treatment plants and found that the index was between good to excellent for the period 2009–2012. The physicochemical property of the groundwater used for drinking in Erbil City was assessed by Toma, et al. (2013), and they found that the quality for wells at different places at Erbil City was varying between good to excellent for a time period 2004, 2005, and 2012.
The purpose of this study is developing a DWQI for Erbil City to assess the water physicochemical quality depending on a database collected over a long time period of time from 2003 to 2017 for the three water treatment plants. However, several studies as mentioned above were made about this subject, but they all were preliminary and did not cover long-term time period. This selected time period is important as there was a significant and large growth in population numbers and residential neighborhoods in the city at that time. Hence, this study can be considered as the first attempt that applied to cover this long time duration. This paper highlights also the variation in physicochemical major parameters of drinking water in Erbil City that comes from the three treatment plants to evaluate the acceptability and to give a historical determination of the treated water for drinking purposes and for other human needs within Erbil City from 2003 to 2017. Different statistical analysis methods have been applied: Analysis of variance (ANOVA), Pearson’s CM, and multivariate analysis to the collected data to determine the spatial and temporal variance of physicochemical parameters examined during the period 2003–2017. It is worth to mention that this period does not cover the water treatment plant Efraz 3 as it started to work since 2006.
2. MATERIALS AND METHODS
2.1. Study Area
Erbil City is situated at the North of Iraq and it is the capital of Erbil Province and the Kurdistan Region of a population of more than two million people. Erbil City lies at a latitude of 36°19? N and longitude of 44°00? E and about 380 km North of Baghdad. The climate is semi-arid continental, similar to other parts of Iraqi that characterized by hot dry summer and cold wet winter more rainfall in the north (Aziz, 2011).
The Greater Zab River originates in Turkey and is partly regulated by the Bekhme Dam, and its length is 392 km from the source to the end, where it merges with the Tigris River. The Greater Zab River is the only source of surface water in Erbil City for drinking and other purposes (Shareef and Muhamad, 2008). Three water treatment plants (Efraz 1, Efraz 2, and Efraz 3) were constructed on this river at three different positions [Figure 1]. These plants are the main source for drinking water and other purposes in Erbil City (Aziz, 2009). The water treatment plants are Efraz 1 (conventional WTP) constructed in 1968 with a design capacity of 38400 m³/day, Efraz 2 constructed in 1985, which supplies about 44000 m³/day, and Efraz 3 constructed in 2006 with a design capacity of 144,000 m³/day (Toma, 2013). The treatment processes in these plants include four main steps: Screens, sedimentation (coagulation and flocculation), filtration, and chlorination (Goran, 2010).
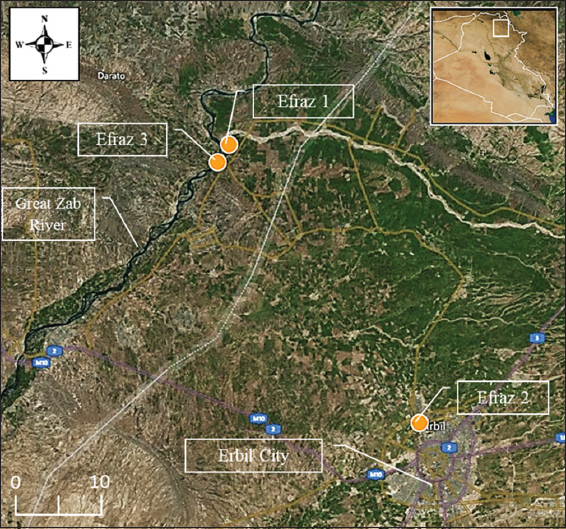
Figure 1. Locations of Erbil City, Greater Zab River, and sites of drinking water treatment plants: Efraz 1, Efraz 2, and Efraz 3
2.2. DWQI Structure for Erbil City
In this study, water samples were provided by Erbil City Municipality Directorate Center for the years 2003–2017. The characteristics of water samples were analyzed in the laboratory of the Erbil City Municipality Directorate Center, where they use highly pure chemicals and double distilled water for preparing solutions for analysis. Procedures for selected groundwater constituents followed for analysis have been in accordance with the standard methods for the examination of water and wastewater (Apha, et al., 1998). The validity and quality of data resulting from water sampling are dependent on many factors such as collecting representative water samples, practicing quality assurance in the field, and properly analyzing the parameters in the water samples (Tebbutt, 1997).
WQI was determined in this study on the basis of various physicochemical parameters such as pH, electrical conductivity (EC), turbidity, total alkalinity, total hardness, sulfate, chloride, nitrate, calcium, sodium, and potassium and other different parameters of water samples. The bacteriological parameters of drinking water samples were not included as all tests showed zero results of MPN of coliform, thermotolerant coliform, and MPN of Escherichia coli during the investigation period. Depending on the collective expert opinions taken from different previous studies on the perceived effect of each parameter on the primary health and various human uses (Srinivasamoorthy, et al., 2008; Vasanthavigar, et al., 2010), the relative weight assigned to each parameter was ranged from 1 to 5 according to the importance of the parameter for drinking purposes. The relative weight assigned to each parameter was ranged from 1 to 5, based on the importance of the parameter for drinking purposes. Water quality parameters were studied in respect to their suitability for human consumption. The used “standards” (permissible values of various pollutants) for the drinking water have been recommended by the World Health Organization (World Health Organization, 2004). High assigned weights were given to TDS and Cl, while Na and SO4 have a moderate assigned weight each. Ca, Mg, and pH each have assigned weights of low-moderate each. The maximum weight of 5 has been assigned to MPN of total coliform and MPN of E. coli for their main importance in drinking water quality assessment. These two parameters are considered as key indicators of any pollution happened due to mixing with sewage or other sources that generated from anthropogenic activities. The subindices were first calculated for each parameter and then used to determine the DWQI.
DWQI, in this work, was developed according to the US NSFWQI (Baghapour and Shooshtarian, 2018; Gharibi, et al., 2012; Sharda and Sharma, 2013; Tyagi, et al., 2013). This index can be used to assess the quality of any water body and is mathematically expressed in Equation 1:

Where Qi is sub-index water quality of i-parameter, Wi is relative weight of i-parameter, and N is the total number of water quality parameters (Issa, 2014). Many other ways to calculate WQI are existed for particular regions and conditions such as WQI for surface water resources or for drinking water (Poonam, et al., 2013). For calculating WQI, the relative weight Wi is usually inversely proportional to the standard value Vstandard for each i-parameter (Tiwari and Mishra, 1985)

Where K is a constant and Vstandard is a water quality standard value for each parameter that adopted by the World Health Organization, 2011. The relative weight is then determined as follows.

Where wi is the assigned weight of each i-parameter. The rating sub-index water quality (Qi) is calculated according to the following Equation 4:

While the sub-index water quality for pH (QpH) was calculated on the basis of the following relation.

Where Vactual is the value of the water quality parameter obtained from the water sample, Videal is the ideal value of pH which is considered to be 7.00, and Vstandard is the value of quality parameter recommended by the WHO. Qi equals 0 when a pollutant is totally absent in the water sample, and Qi equals 100 when the value reaches its maximum allowable limit (MAL). Accordingly, a higher value of Qi represents more polluted sample (Alobaidy, et al., 2010). MAL values are used in this study as per the standards established by the WHO, 2011. DWQI values are classified into five categories: Excellent water (DWQI < 50), good (DWQI 50–100), fair (DWQI 100–200), marginal (DWQI 200–300), and poor (DWQI > 300) (Abtahi, et al., 2015; Monjerezi and Ngongondo 2012). Vstandard for total coliform and total fecal coliform are set to be zero in drinking water (World Health Organization, 2011). In this case, to get rid of the problem of the denominator is zero in Equation 4, Qi value is considered to be equal to Vactual.
2.3. Statistical Analysis
Analysis results of water samples from Erbil City water treatment plants: Efraz 1, Efraz 2, and Efraz 3, were subjected to statistical analysis methods such as ANOVA, Pearson’s CM, and a multivariate analysis of agglomerative hierarchical clustering (AHC) analysis. The advantages of statistical analysis are obtaining a useful method to establish a comprehensive understanding for both the spatial and temporal differences of physicochemical and bacteriological qualities over the years 2003–2017 for the drinking water in Erbil City. ANOVA was first employed to determine the differences in the mean values of drinking water samples parameters among the three plants. Pearson CM was used to discover the strength of relationships between each two or more of the studied parameters. AHC was applied in this work to classify groundwater samples according to their temporal variation of physicochemical parameters in water samples. Ward-algorithmic linkage method and Euclidean distance are the basis to conduct statistical cluster analysis. AHC was applied in this work to classify samples according to their content variation of physicochemical parameters. Ward-algorithmic linkage method and Euclidean distance are the basis to conduct statistical cluster analysis. Cluster analysis was performed in this work using XLSTAT software (version 2014 for Excel 2013 software).
3. RESULTS AND DISCUSSION
3.1. Descriptive Statisticss
The descriptive statistics for the obtained dataset of drinking water quality of 17 quality parameters from 2003 to 2017 is shown in Table 1 which includes the mean, median, standard deviation, maximum, and minimum values for each monitoring period. The mean values of the investigated parameters in drinking water samples have been arranged according to their quality rating.
Table 1. Descriptive statistics and assigned weights of physicochemical and bacteriological parameters of drinking water samples produced from the three DWTPs in Erbil City during 2003–2017
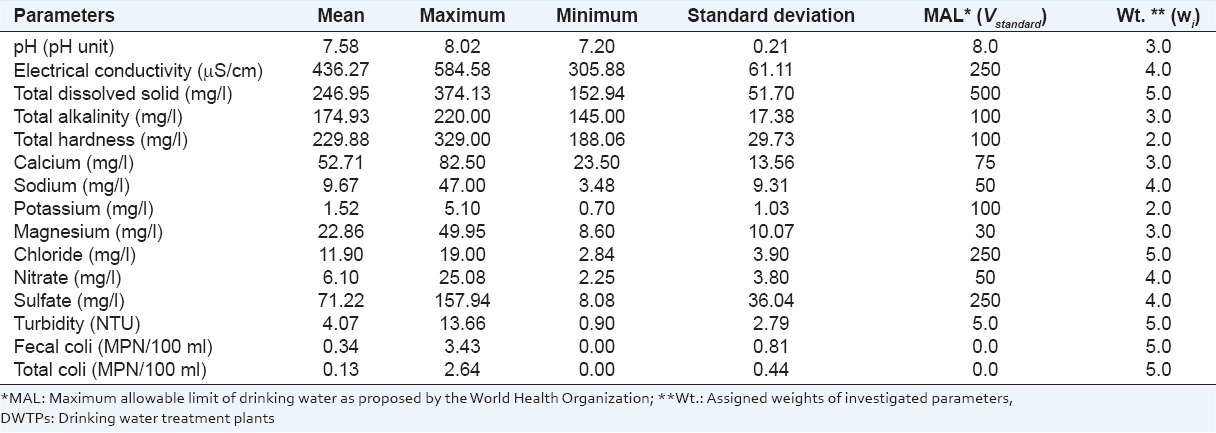
Table 1 illustrates the mean values of physicochemical and bacteriological parameters obtained from a dataset of 4389 water samples. The samples are collected over the period of 2003–2017 from the main three DWTPs in Erbil City: Efraz 1, Efraz 2, and Efraz 3. As presented in Table 1, the mean values for some of the parameters in water samples are higher than MAL proposed by the World Health Organization (2011). EC has to mean value of 436.27 (µS/cm), and this value is higher than the MAL of 250 µS/cm. Similar condition exists for many parameters such as total hardness and total alkalinity. Their mean values are approximately the double of the MAL of 100 mg/L for each. This fact reveals the significance of these parameters on the chemistry of drinking water quality in Erbil City. Mean values of Mg in water samples are 22.86 mg/L, which is close to the MAL for Mg of 30 mg/L. Hence, this level discloses the significant role of Mg in the drop of drinking water quality. Noticeable mean values of bacteriological parameters are compared with standard MAL. The rest of the parameters display low levels in examined drinking water samples.
3.2. DWQI of Erbil City’s DWTPs
The annual WQI values for DWTPs at Erbil City during the period of 2003–2017 have been calculated and presented in Figure 2. However, the annual WQI values for the three DWTPs build a clear and general vision for the physicochemical and bacteriological quality of drinking water produced from these plants in the study area during the observation time. All the annual DWQI fall in good quality of DWQI is <100. Nevertheless, it can be observed that a considerable higher DWQI value of 133 was recorded for DWTP Efraz 1 in the year 2004. From 2003 to 2007, the annual DWQI values are significantly higher than those for the rest of the investigation period.

Figure 2. Annual drinking water quality index in Erbil City of treated water produced from three Water treatment plants: Efraz 1, Efraz 2, and Efraz 3 over the period (2003–2017)
The effect of dryness in the area, specifically in the year 2008 (Nanekely, et al., 2016), does not show an evidence that increasing of WQI value is related to rainfall decline throughout that period. The elevation of DWQI values at the duration 2003–2007, especially in the upstream plant Efraz 1, is most probably due to the direct discharge of wastewater and effluents to Greater Zab River (Bapeer, et al., 2006; Shareef and Muhamad, 2008). The reason for that, at that period, environmental limits and legislation seem to be poorly applied. In general, results showed DWQI <100 in all DWTPs, with one exception, meaning that, for temporal variation, the drinking water quality was generally safe throughout the study period. The peak year of registered DWQI value was 2004 in Efraz 1. The poor performance of old DWTP Efraz 1 at that period was might be behind the clearly observed depletion of DWQI, and this seems to be overcome gradually by later maintenance works.
3.3. Analysis of DWQI Rating Sensitivity to Water Quality Parameters
To understand the importance of each parameter in establishing DWQI, the average value of the DWQI was calculated with removing one parameter each time to determine the sensitivity of the DWQI to these physicochemical and bacteriological parameters (Rickwood and Carr, 2008). Figure 3 presents the range of removing each parameter, and the highest positive weight on DWQI value was +3.11 with eliminating Na. The lowest negative weight of –8.6 was happened with eliminating EC nitrate. The reduced DWQI, when EC was eliminated, was not considerably correlated to the original DQWI (R2 = 0.55), and this means that the established DWQI for the three DWTPs is strongly sensitive to the EC parameter. Nevertheless, none of the other parameters did not show a strong effect on the DWQI value (R2 > 0.90). The sensitivity analysis also showed the eliminated parameters with a positive effect on DWQI such as Na, K, TDS, and pH which are the higher compliant parameters. On the other hand, parameters with a negative effect on DWQI such as EC and turbidity mare the higher violent parameters causing deterioration of treated water quality produced from the three DWTPs working at Erbil City.
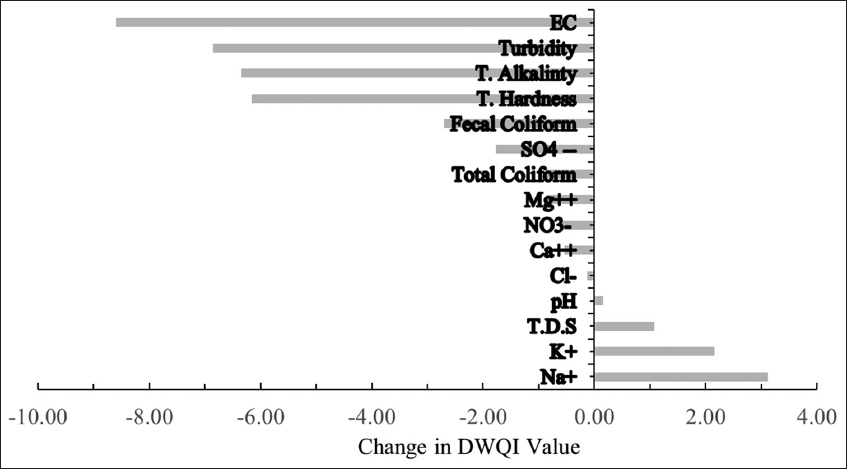
Figure 3. Changes in average drinking water quality index value caused by eliminating each water quality parameter
3.4. ANOVA Analysis of DWTP-Treated Water
The ANOVA was conducted to search any significant variation among the treated water samples examined in this study for the three SWTPs: Efraz 1, Efraz 2, and Efraz 3. This ANOVA analysis was implemented for variation of average physicochemical and bacteriological parameter levels in water samples and with replications using 95% confidence level. The ANOVA results disclosed that statistically there are no significant variances among treated water samples at a confidence level of 95 % (P > 0.05). Efraz 3 was included in analysis starting from 2006 the year it was constructed. The resulted P-value was 0.149, F value was 1.911, and Fcrit was 3.0157.
3.5. AHC Analysis
The hierarchical cluster analysis (HCA) can identify any similarity that may exist among clustered results regarding their locations or the physicochemical and bacteriological parameters over the time investigated of 2003–2017. This was done by showing considerable internal clusters homogeneity and significant external heterogeneity concerning clusters.
Figure 4 displays the results of the dendrogram of HCA of three generated distinct clusters. Nonetheless, the ANOVA showed no significant difference among DTWP-treated water samples. The dissimilarity of treated water samples in terms of sampling treatment sites was classified into three clusters. Groups of sample locations are Cluster 1, Cluster 2, and Cluster 3 which are corresponding to the three DWTPs: Efraz 3, Efraz 2, and Efraz 1, respectively. On this basis, it can be realized that spatial dissection of water samples appears among treatment plants regarding the investigated parameters. As the Efraz 1 defined in cluster 3 is the older water treatment plant constructed at downstream of the Greater Zab River, the sample showed higher levels of water quality parameters than from other plants, more specifically between the years 2003 and 2007. Therefore, Efraz 1 showed more dissimilarity from the two plants Efraz 2 and Efraz 3 as illustrated in Figure 3. However, the deterioration of water quality to river water quality has not shown a significant effect on plants distinction.
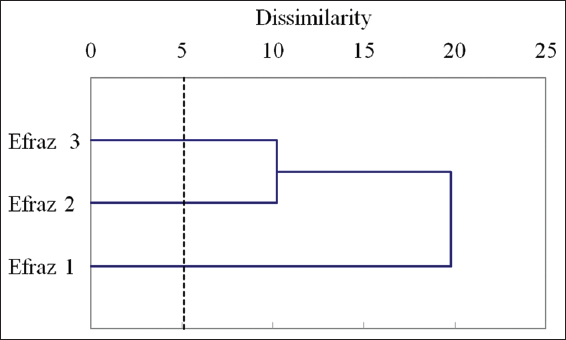
Figure 4. Dendrogram using Ward’s method for treated water quality of three drinking water treatment plants in Erbil City during the period 2003–2017 (except Efraz 3 starting from 2006 as it was constructed in this year)
Figure 5 presents a hierarchical clustering analysis performed on the tested quality parameters in treated water samples. The results display three main clusters for the annual water samples. Cluster 1 includes NO3 and Ca, cluster 2 includes K and Na, whereas cluster 3 includes the remaining of tested physicochemical and bacteriological parameters. As for cluster 3, it is reasonable to see some parameters such as turbidity with bacteriological parameters in one cluster as any increase of turbidity enriches the bacteria growth and microorganisms, leading to an increase in the total and fecal coliform bacteria. From obtained clusters, it can be identified that cluster 1 is most possibly come from soil erosion and agriculture fields at the upstream areas, while cluster 2 is most likely represents one source of soil erosion from the river basin area. However, cluster 3 shows the combined effects of industrial agricultural and urban sources. Consequently, the treated water quality parameters are dominated mainly by natural, agricultural and urban sources.
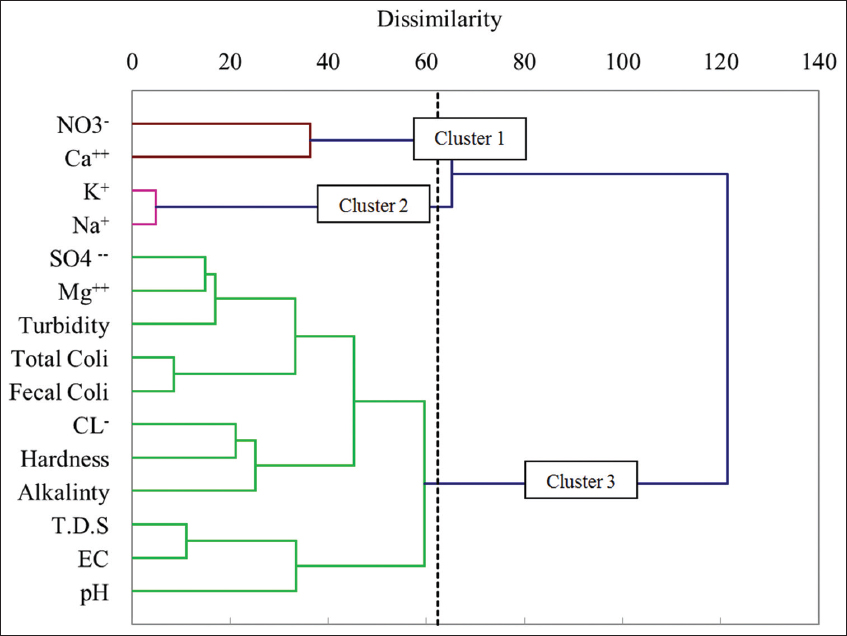
Figure 5. Dendrogram using Ward’s method for physicochemical and bacteriological parameters of treated water samples from three drinking water treatment plants in Erbil City during the period 2003–2017 (except Efraz 3 starting from 2006 as it was constructed in this year)
Taking into account the treatment and disinfection efficiency in the three DWTPs, the majority of treated water quality samples are suitable for drinking purposes. However, the authorities should pay more attention to control the ongoing activities at the river upstream by activating water management programs including construction of wastewater treatment systems.
4. CONCLUSIONS
Drinking water quality assessment has been performed for three DWTPs: Efraz 1, Efraz 2, and Efraz 3, which supply Erbil City with treated water over the period of 2003–2017. Thirteen physicochemical and two bacteriological were analyzed. Mostly, EC, total alkalinity, and total hardness among the tested parameters exceed the MAL according to World Health Organization (2011) standard. DWQI was then established for the three DWTPs based on the US NSFWQI to assess the drinking source water quality of Erbil City for the investigation time 2003–2017. DWQI results showed that drinking water quality falls within the excellent to good quality. A fair quality was observed in the year 2004 for the station Efraz 1. Marginal or poor quality was not found during the study period. Sensitivity analysis revealed that is strongly sensitive to EC. The multivariate statistical technique (AHC analysis) explored the similarities between examined sites and parameters in order to categorize drinking water samples into similar classes. The first HCA application has allocated each DWTP in a separate cluster. HCA application has then identified three groups among the drinking water quality parameters. The classification has recognized that sources affecting drinking water quality in Erbil City are mainly: Natural, agricultural, and rural wastewater. The study described here leads to better understanding the DWTP overall situation and the treated drinking water quality supplied by them to Erbil City. The study showed the usefulness of DWQI and hierarchical clustering analysis for evaluating and monitoring the drinking water quality.