1. INTRODUCTION
Ore microscopy study for some samples from Mawat complex NE Iraq (part of Zagros Suture Zone) showed that the presence of copper ore minerals was irregularly distributed, mainly throughout the basic rocks of MawatOphiolite Complex. The main sulfides minerals identified were: Chalcopyrite, pyrite, bornite, chalcocite, and covellite. Iron hydroxides/oxides including goethite and magnetite were also observed associated with sulfide ore. Chalcopyrite and pyrite were the main primary minerals from which other ores were formed (Yassinet al., 2015). Waraz area has a specific geological significance due to evidence of the existence of copper mineralization in the area (Musa, 2007). Chalcopyrite (CuFeS2) is an industrially important mineral that forms an essential component of high-quality copper ores (Sahyounaet al., 2003). Copper production technology has changed dramatically in the past 25 years with the introduction of solvent extraction, electrowinning circuit as a copper production method. Copper solvent extraction technology produces the most economical copper from low-grade copper ore, which consists of two circuits connected by a common organic phase. The first step is called extraction step, the metal is extracted from the aqueous phase by organic phase. The second step, called stripping step, recovers the metal from organic phase. The second aqueous phase is pure and concentrated (Stevanovicet al., 2009). Once solvent extraction has proved to be a cost-effective way of purifying and concentrating copper from leach liquors, copper producers have begun to consider leaching as a much larger source of copper (Kafumbila, 2015). The solvent extraction of copper consists of contact between aqueous leaching solutions with a specific copper liquid organic extractant the organic extractant is loaded with copper then separated from aqueous leaching solutions (raffinates) and will be sent back to leaching process. The Cu loaded in organic extractant is brought into contact with highly concentrated H2SO4 of electrowinning electrolyte causing the transfer of Cu to the highly concentrated H2SO4 electrolyte. The new organic extractant stripping returns to renew contact with leaching solutions, enrich electrolyte sending to electrowinning when the copper metal removing through electrolysis and organic solvent separates by settler and strip with concentrated sulfuric acid for producing clean product. Finally, the high-grade copper leaching solutions are sent to electrowinning (Kordosky 2002). Electrowinning is the recovery of metal from the loaded electrolyte solution produced by solvent extraction (Tite and Shortlan, 2003). It is the most important process used to produce some of the best quality copper (May et al., 2005). Electrowinning of copper ions is derived from leaching or solvent extraction (Beukes and Badenhorst, 2009). This process is essentially a series of cell batteries. Each cell is made up of electrodes (anode and cathode plates) and filled with strong electrolyte solutions (from stripping process). The DC direct potential voltage applied to cells and, like charging cycle of batteries, the currents flow resulting from chemical reaction occurring in electrolyte, and as consequence of this action copper accumulates on electrodes plate. When enough coating happens, the plate is removed from solution to strip, the accumulated copper and plates are washed and turned over so that the process can be repeated (Calcutt, 2001).
Modern hydrometallurgical processing of copper in the Central African Copper belt involves four stages – namely, leaching, separation, solvent extraction, and electrowinning. The preferred choice for processing ores from the democratic republic of congo (DRC) and Zambia is agitated leaching. Agitated leaching involves reacting copper-containing ore with acid in an agitated tank. The resultant slurry is separated in a solid/liquid separation stage, usually a countercurrent decantation (CCD) circuit. The solution is upgraded in a solvent extraction (SX) circuit, after which LME Grade A copper is recovered through electrowinning (EW). The waste streams are sent to a tailings facility where the acid is neutralized and aqueous elements are precipitated out. The liquid from tailings can be recycled as process water, while the solid content is stored in a tailings dam ( Osmanet al. 2013).
2. MATERIALS AND METHODS
2.1. Solvent Extraction Process
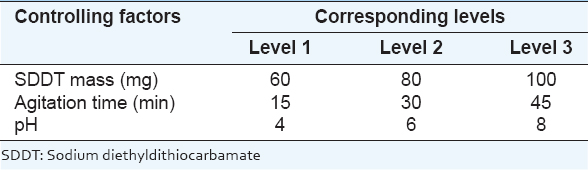
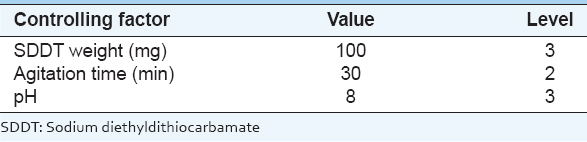
The solvent extraction was done using sodium diethyldithiocarbamate (SDDT) at a grade of 97 % purity from Gainland chemical company. It was purchased from the local market as extractant. The commercial organic diluent was Dichloromethane from Riedel-DE HAEN AG-Hannover which was purchased from local market. Operating variables are: SDDT mass, agitation time, and pH which are selected as three major control factors with three levels corresponding to studied options which are shown in Table 1.
Table 1: Control factors and levels used for solvent extraction process
2.2. Taguchi Design of Experiment
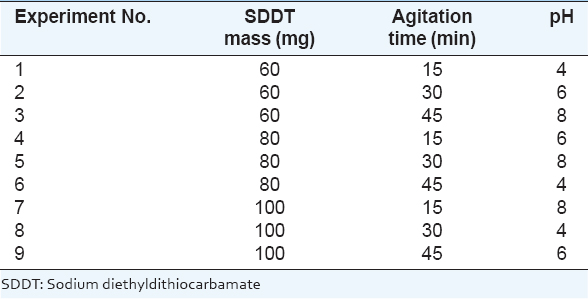
To determine the optimum conditions during solvent extraction experiments, design of experiments by Taguchi method is used. Minitab program is chosen to select and create the proper Taguchi orthogonal array L9 (33) which is shown in Table 2. The parameter numbers and their levels are selected to determine the optimum solvent extraction conditions, using the control factors for the solvent extraction process which is applied in Taguchi orthogonal array (L9) shown in Table 3.
Table 2: Taguchi orthogonal array L9 for solvent extraction process
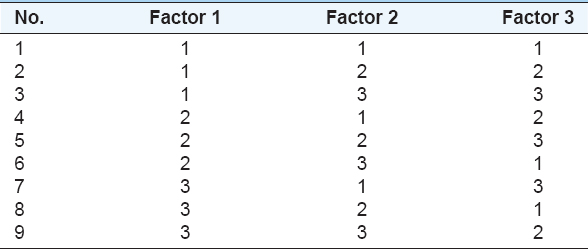
Table 3: The number of experiments used in solvent extraction process
3. EXPERIMENTAL WORK
3.1. Solvent Extraction Process Procedure
In a previous study, the ore samples were taken from Mawat area then concentrated in magnetic separation. The concentrate was used in leaching process using Sulfuric Acid solution and hydrogen peroxide as part of an investigation to extract copper. The operation variables of acid concentration, time, stirring speed, H2O2 concentration, and particle size were selected. After completing all leaching experiments, the results were recorded in the Minitab program worksheet for statistical analysis and the optimum conditions for leaching of copper were chosen to be studied further because copper has a higher concentration in the leaching process. Under the selected conditions, the average leaching efficiency predicted by the Taguchi method was 97.9% Cu (Tomaet al., 2017). After leaching process, a certain volume of 10 ml of copper pregnant leach liquor is taken and mixed with an amount of extractant agent (SDDT) in a flask. The A/O ratio was set at 1:1 and the temperature was kept constant at (25°C). The mixture result is shaken using a reactor. The organic diluent (dichloromethane) was added to the mixture that was obtained, and the mixture result is stirred using a stirrer in predetermined agitation speed and different contact time. After the stirring was stopped, the mix solutions are transferred to 500 ml separating funnel, and when the reaction reached equilibrium, the two phases are separated. The separate aqueous solutions are filtered using Whatman No. 42 filtration paper for removing entrained organic solution and the aqueous phase then analyzed by atomic absorption to determine the copper cation concentration. All the experiments were repeated twice to ensure the reproducibility of the results. Finally, the loaded organic solution was stripped 3 times using 3 M sulfuric acid solution with 1:1 A/O ratio. All striping solutions were collected and combined to do chemical analysis.
3.2. Electrowinning Process Procedure
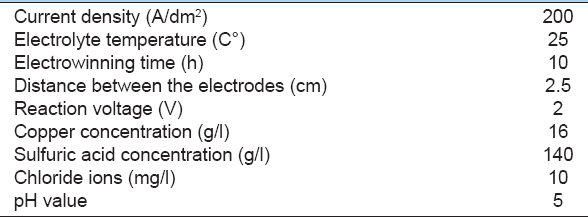
After solvent extraction process, the stripped solution will be used in the electrowinning process to obtain the metallic copper. The process is carried out in a cell consisting of a glass beaker 500 ml volume. The anode was a lead sheet, the cathode was a stainless steel sheet. The electrical circuit consisting of 5V DC power supply was connected to the cell, the experiment is done in 25°C temperature, reaction voltage of 2 V, 200 Am−2 current density, and 2.5 cm distance between electrodes.
Finally, after the process is carried out, the deposited copper on the cathode is stripped then washed with deionized H2O, dried in air, weighed and analyzed. The current efficiency of copper has been calculated based on the ratio of weight gained in the cathode to initial weight of copper deposit and the level of purity for copper cathodic deposition test was found by chemical analysis.
4. RESULTS AND DISCUSSION
4.1. Solvent Extraction Process
In this study, the following parameters have been selected: Mass of the extractant, agitation time, and pH value of aqueous solution, whereby extraction of copper from synthesized solutions were investigated. All the experiments are presented in the Taguchi orthogonal array for the solvent extraction process, and the results of this process are shown in Table 4. The copper extraction ratio is calculated using the following equation (Touati and Hassan, 2011).
Table 4: Extraction ratio of copper for solvent extraction process
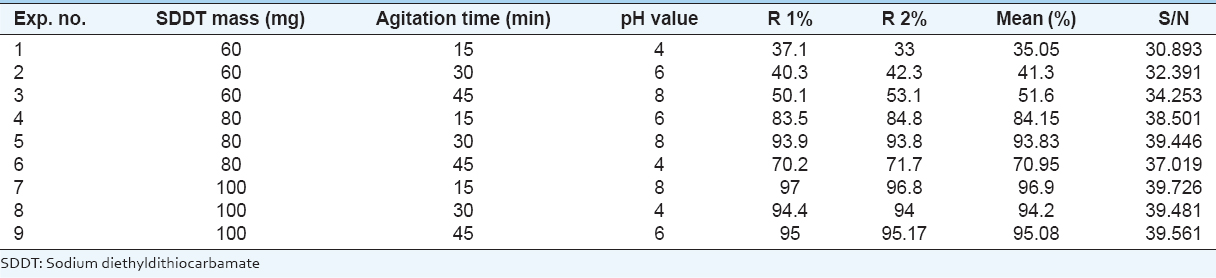
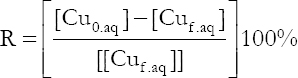
The obtained results were expressed in terms of extraction ratio R (%).
Where [Cu0.aq] and [Cuf.aq] were the initial and the final Cu (II) concentration in the aqueous phase, respectively.
4.2. Optimum Conditions for Solvent Extraction Process
The optimum conditions for solvent extraction of copper are shown in Table 5.
Table 5: The optimum conditions values in the solvent extraction process
4.3. Analysis of Variance (ANOVA)
Collected date from Taguchi design of experiment can be analyzed using ANOVA method. ANOVA method accounts for the variables from all involved sources including error term. When error sum of squares is higher than the sum of squares of controlled factors, ANOVA method with percent contribution indicates that the selection of optimum levels of the controlled factors may not be useful.
Which can be calculated by the following equations:
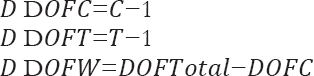
Where, C represents the level of each controlled factor, T denotes the number of experiments.
Which can be calculated by the following equations:
Where, SST total sum of squares, SSW sum of squares within columns or Error, SSC sum of squares between columns, N number of experiments, n number of controlled factors, CF Correction Factor.
Which can be calculated by the following equations:
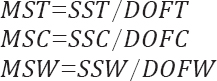
The contribution percentage of a controlled factor to a total sum of squares can be calculated from the equation below. The percent contribution can be used to determine the ability of a controlled factor to reduce variations. Contribution percentage is not only determined for controlled factors but also for error. The percent contribution of error (ρerr) provides a judgment of the adequacy of an experiment. When, ρerr ≤15%, it implies that no important factors are omitted from the experiment. When ρerr ≥50%, it is assumed that some important factors are omitted, conditions of the experiment are not precisely controlled or measurement of errors is made.
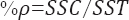
The effective percentage for each factor on the copper solvent extraction efficiencies is calculated by Minitab program ANOVA illustrated in Table 6.
Table 6: ANOVA for solvent extraction of copper
4.4. Effect of the Extracting Agent mass
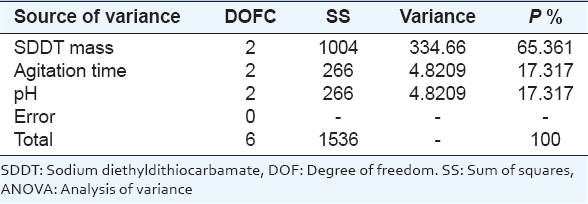
The influence of extractant mass SDDT varies from 60 to 100 mg, with the ratio of organic to aqueous phase equal to 1 and agitation stirring speed is 650 r.p.m. In Figure 1, it is shown that the percentage of extraction increases to 95.39% due to the extractant mass is increasing to 100 mg which then exhibited the saturation behavior. Therefore, 100 mg of the extractant mass is adopted to avoid migration of any amount of SDDT to aqueous phase after the extraction. Results data indicate that the mass of 100 mg is the optimum value to be used in this study.
Figure 1. The effect of solvent extraction factors on extraction ratio
4.5. Effect of Agitation Time
The agitation time may have some influence on recovered copper. The parameter varies between 15 and 45 min. Result was shown in Figure 1. The extraction ratio value is not far from the average value of 76.44%, indicating a low influence on the recovery of copper. Moreover, higher extraction ratio is reached after 10 min of agitation. Hence, it could be considered as optimum time value. This value is reached after only 10 min of agitation, indicating negligible chemical resistance with instantaneous migration in result complex to organic phase. A contacting time of 30 min is considered for ensuring state of equilibrium.
4.6. Effect of the Initial pH Value
In this study, the pH value for aqueous solution before extraction was varied from 4 to 8 using solutions of HNO3 (0.1M) and NaOH (0.1M). According to Figure 1, the extraction ratio increases with increasing pH value, reaching 80.77% at pH = 8. The extraction ratio decreases in a more alkaline medium (pH >8) when the cation of hydrolysis at the aqueous phase was sufficiently disturbed from chelating, allowing elements to return to aqueous phase, thereby decreasing the extraction ratio (Meterfiet al., 2012).
4.7. The Optimum Solvent Extraction Conditions
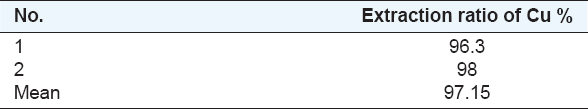
The optimum conditions for solvent extraction of copper are chosen for further study because copper has a higher concentration in the solvent extraction process. Under the chosen conditions at constant temperature 25°C, the average solvent extraction ratio predicted by the Taguchi method is 97.15% Cu. To confirm this result, two solvent extraction experiments were conducted, and their results were presented in Table 7, which shows the results of the two experiments and their means.
Table 7: The optimum solvent extraction experiments results
4.8. Electrowinning process
The optimized recovery of copper from the cathodic deposition of copper in sulfuric acid solution was done according to the conditions mentioned in the following Table 8.
Table 8: Copper electrowinning conditions
With all other conditions remaining constant for each scenario, the overall recovery of copper was calculated using the following Equation:
After electrowinning is carried out, the results for the experiments were taken to quantitative analysis using The X-ray fluorescence spectrophotometer (XRF), scanning electron microscopy (SEM), and X-ray diffraction (XRD). The patterns are shown in Figures 2-4 indicated the presence of pure copper as illustrated in Table 9.
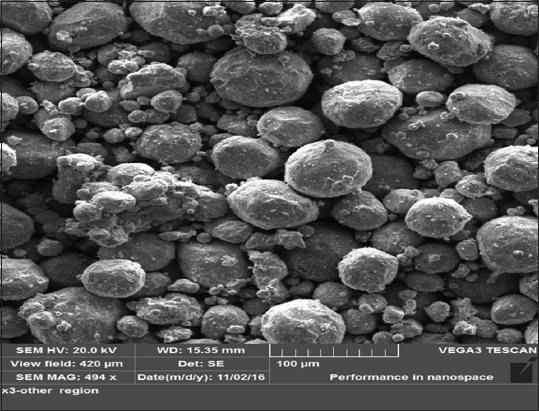
Figure 2. Scanning electron microscopy of pure copper
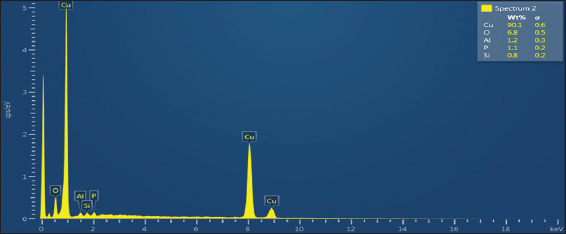
Figure 3. Energy dispersive X-ray of pure copper
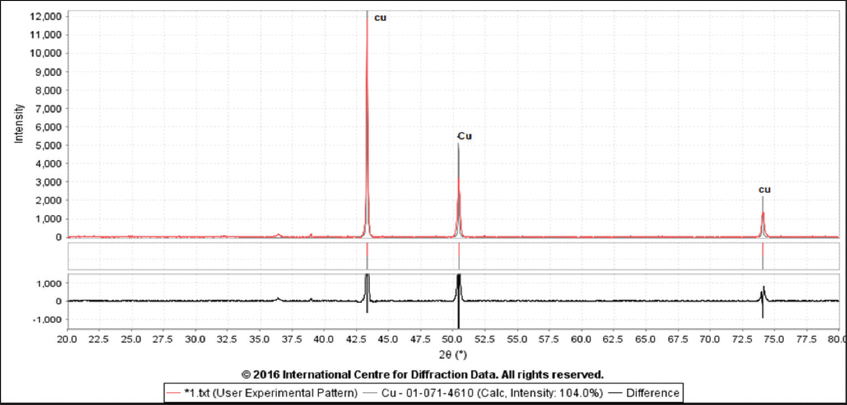
Figure 4. X-ray diffraction analysis of the pure copper
Table 9: The Chemical composition of pure copper
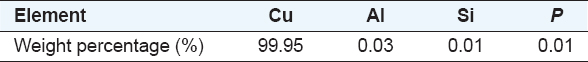
4.9. Chemical Analysis XRF
The chemical analysis of the elements was performed using XRF type (AMETEK). The analysis was conducted at the Geological Department, College of Sciences, University of Baghdad as shown in Table 9.
4.10. SEM-Energy Dispersive X-ray (EDX) Analysis
The chemical composition of ophiolite ore was analyzed using scanning electron images type VEGA3 LUM and energy dispersive X-ray spectra type Oxford Max3 to obtain a primary characterization of the ore. Figure 2 shows the (SEM) analysis of the pure copper, while Figure 3 depicts the corresponding EDX spectrum of copper done at the University of Technology in the Department of Production Engineering and Metallurgy.
4.11. XRD Analysis
The mineralogical analysis of the prepared sample taken from copper ore material and product concentrate was made by XRD analysis type (BRUKER), voltage 40 kv, current 30 MA, χ Cu 1.540 A°, Scan rate (speed) 5–10º Min. The analysis was performed at the Geological Department, College of Sciences, University of Baghdad.
5. CONCLUSIONS
In this study, the optimum conditions for solvent extraction process of chalcopyrite ore are using extractant mass SDDT (100 mg), agitation time (30 min), pH value (8), which were determined by Taguchi method, indicating the following:
-
1- Based on the solvent extraction experiments, the following conclusions were made:
-
a- By increasing the extractant mass SDDT, the extraction ratio increases.
-
b- By increasing the pH value, the extraction ratio increases.
-
c- After shaking for 10 min, the extraction ratio increases.
-
d- Finally, this study showed that the SDDT can safely be used as an extractant agent for extracting Cu2+ from sulfuric acid solution in various pH values by the solvent extraction process.
-
-
2- Based on the electrowinning experiments, the following conclusions were made:
-
a- After calculating copper mass, the copper extraction ratio was obtained to be equal to 73%.
-
b- XRD patterns show the presence of pure copper at (100%).
-
The results obtained during this laboratory study showed the possibility of extracting copper from Mawat complex sulfide ore and that further research can be conducted to find the other practical conditions to utilize this raw ore to produce and provide an economical source of copper in Iraq.