1. INTRODUCTION
One of the most striking features of iron oxides is their eye-catching color. To some extent, these colors are characteristic, and thus diagnostic of the type of the mineral, crystal size, shape, and impurities within the crystal structure. Even small differences in color can effectively be distinguished with the naked eye and easily quantified by means of color charts, for example, the Munsell color book.
Iron oxides determine soil color and have a major influence on physical and chemical characteristics of soils (Schwertmann, 1993). For more than half a century, Munsell system has been used by the pedologists to measure soil color (Munsell Color Company, 1975). It is essentially based on hue (H), which is the attribute of color perception denoted as blue, red, yellow, and so on; value (V) which is lightness, and chroma (C), which is degree of difference from black to white.
The yellow, brown, and red color of iron oxide make their natural and spatial distribution in soils easily recognizable, and their colors often form the basis for naming, for example, Red Earth that is used for classifying soils. The color variations are caused by different Fe oxide minerals in the system (Cornell and Schwertmann, 2003).
Hematite has the most reddish average hue, and magnetite has the blackest average value while ferroxyhite, ferrihydrite, akaganite, lepidocrocite, maghemite, schwertmannite, and goethite show yellower hues. The redder hues of hematite and ferroxyhite are due to face-sharing octahedral where adjacent Fe centers are as close together as 0.29 nm (Scheinost, 1999). In contrast, the other minerals are only built up from edge- and corner-sharing octahedral, where Fe centers are 0.3–0.33, and 0.35 nm apart, respectively, giving rise to more yellowish hues. Magnetite has the darkest values due to the existence of Fe+2 and Fe+3 causing intervalence charge transfer bands. The darker values of maghemite, hematite, ferroxyhite, akaganite, and ferrihydrite correspond also to their lower chroma (Scheinost and Schwertmann, 1997).
In spite of a substantial variability of color within the minerals, goethite, hematite, lepidocrocite, and ferrihydrite can be easily distinguished by hue and chroma. Hematite is always redder than 4.1 YR, and goethite is yellower than 8.1 YR. Ferrihydrite and lepidocrocite have intermediate hues and are separated by chroma. The color of maghemite is unique due to values lower than 3.6 and hues yellower than 6.2 YR. Feroxyhite overlaps with hematite in hue and value but exhibits a higher chroma than hematite. Akaganeite overlaps with ferrihydrite in H, V, and C. Only akaganeite samples with a hue yellower than 5.5 YR may be reliably distinguished from ferrihydrite. In conclusion, for six out of eight iron oxide minerals color is a reliable indicator of a successful mineral synthesis (Cornell and Schwertmann, 1996).
2. MATERIALS AND METHODS
Before this investigation, only a limited number of reports and scientific papers, mainly geological reviews, were available on the studied area. Asnawa is a small village near the Iraq-Iran border, located about 3 km to the east of Penjween town which belongs to Sulaymaniyah governorate. Asnawa means the “Village of Iron” or a place where iron is rich in the area [Figure 1]. The iron ore of Asnawa is located to the south east of Penjween town. A difficult unpaved road; from Penjween climbs through the Bilkian valley leads to the area of the iron ore which can be visited only by means of four-wheel drive vehicles. The road is 1350 m high in elevation and takes only half an hour to reach to the quarry. The areas surrounding the road and the iron ores are dangerous as being full of remnants of weapons, especially minefields and different kinds of unexploded shells.
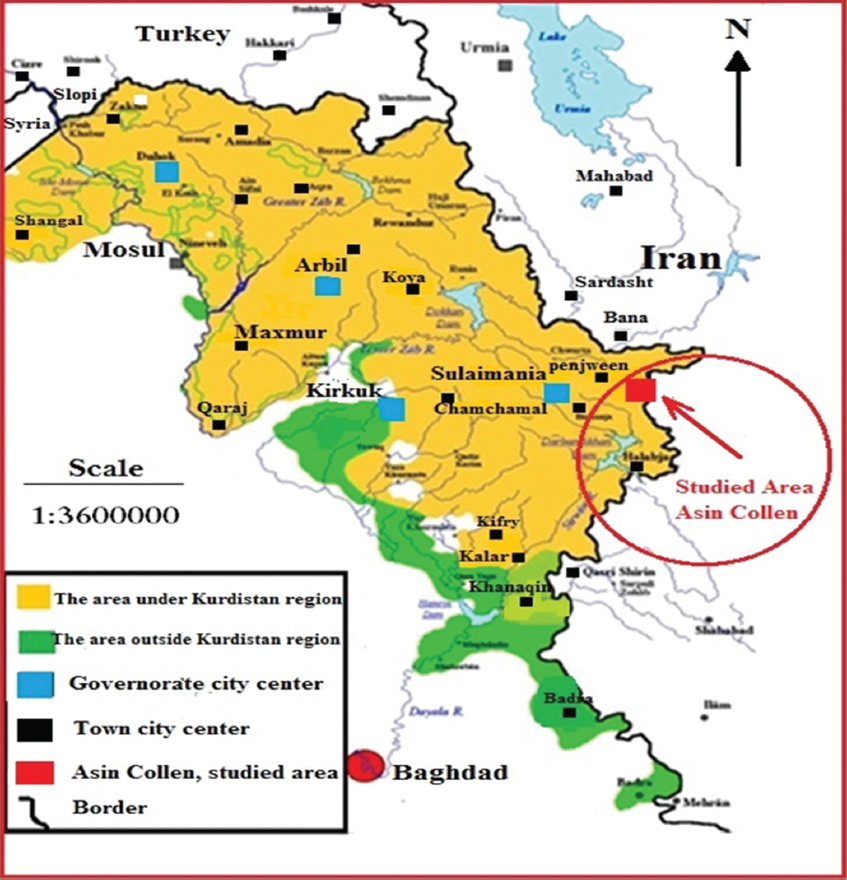
Figure 1. Illustration map of Kurdistan region shows the area of study
Locations of the soil samples were chosen depending on soil color variance in the area, therefore, the area was divided into three zones: Zone (A) the quarry area which is located on the mountain peak, zone (B) the hills surrounding the quarries, and zone (C) is the area closer to Penjween suburbs. 40 surface soil samples were randomly collected between these zones. Precaution to the military remnants and mine was seriously counted for each location GPS coordination was measured [Figure 2]. Bulk surface samples of 2–3 kg were taken and put in plastic bags. The samples of zone A were numbered as S1, S2 to S5, whereas the samples of zone B were numbered as S6 to S20, and the samples of zone C were numbered as S21, S22 to S40. The locations of soil samples were selected according to the visible change in color intensity of the studied area.
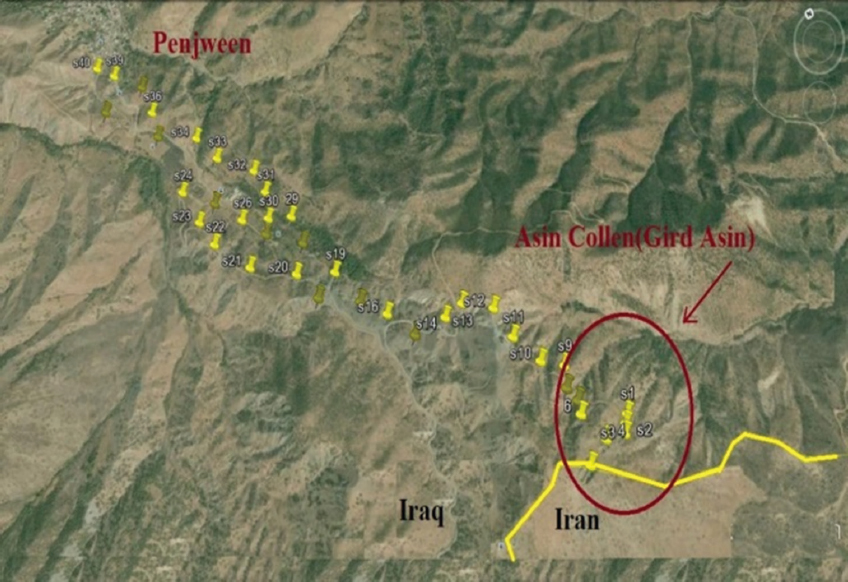
Figure 2. Locations where soil samples to taken according to GPS coordination
In the laboratory, the soil samples were emptied into flat trays and air-dried at room temperature with frequent turned by hand. Stones, roots, and fibrous material were removed. After drying, the samples were gently rubbed down to pass 2.0 mm sieve. The material <2 mm was designated as fine earth. The colors of air-dried soils were measured using Munsell color chart book. Extraction of Fe oxides was carried out using aqua regia solution. Aqua regia mixture was prepared by mixing 1 volume of concentrated HNO3 and 3 volumes of concentrated HCl (Kisser, 2005). The solutions of the digested samples were analyzed by AAS (AAS-UNICAM model 929) with the use of prepared standards.
3. RESULTS AND DISCUSSION
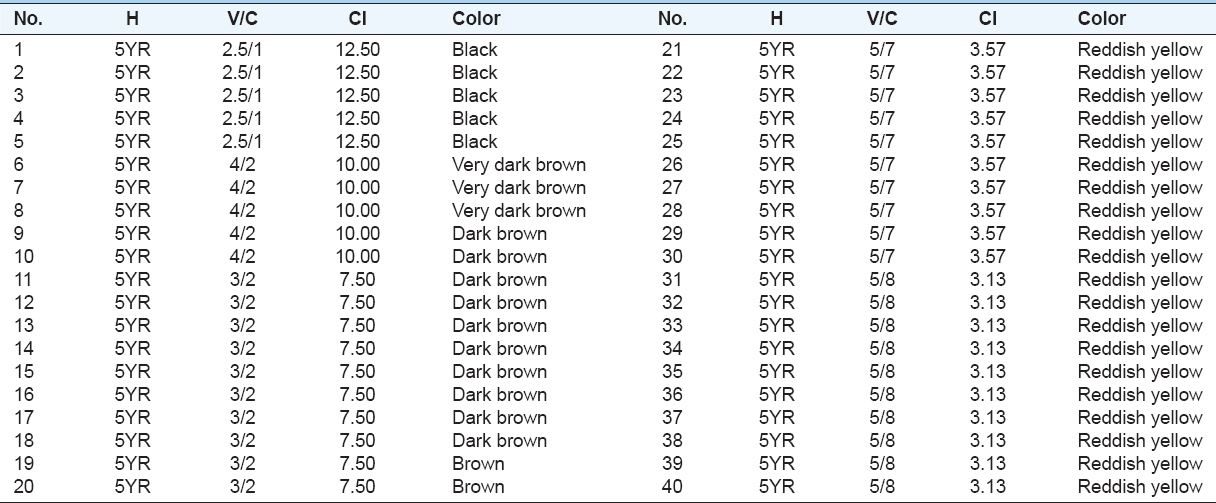
During the site visit, variation in the color’s intensity was clearly visible in the field. The colors’ range after they measured in the laboratory against colors available in the Munsell color book have Munsell hue of 5YR and value/chroma of 2.5/1 to 5/8 suggesting the presence of iron oxides in the soils [Table 1]. Iron oxides determine soil color and have a major influence on the physical and chemical characteristics of soils (Scheinostet al., 1998; Schwertmann, 1993). Table 1 summarizes hue, value, and chroma of the soil samples determined in the laboratory by Munsell color chart.
Table 1: Hue (H), value (V), and chroma (C) of the soils with their colors determined by Munsell color chart and CI measured by (10 H) × V/C
Soils of zone (A) have Munsell hue of 5YR and value/chroma of 2.5/1 which represent black color. They were darker than soils of zone B and zone C. They had the typical smell of iron ore (metal) which was reasonably close to the smell of sulfurous acid and wet rust. Stones and boulders were black in color, rusty, and surprisingly heavier than one would expect. Soils of zone B which were varied in color were ranged from very dark brown to dark brown then brown. Smell of iron metal was also detected in these areas indicating the presence of iron metal in the soils. Visible change in color was observed for soils of zone C. They were lighter than soils of zone A and zone B. These soils were reddish yellow in color with hue of 5YR and value/chroma of 5/7 and 5/8 [Figure 3).
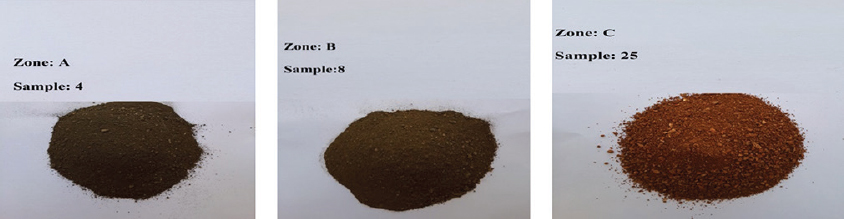
Figure 3. Few color samples representing soils of zone A, B, and C
Another characteristic of the soils in the field was their magnetic force that pulled other ferromagnetic materials such as iron [Figure 4]. Fonteset al. (2000) studied magnetic measurements of five different soils and reported that soils containing iron-rich with spinel structure such as magnetite that impart soil magnetization are considered magnetic. In this study, the magnetic attraction force was clearly greater in the soils of zone A compared to soils of zone B and C, respectively. This was possibly due to higher contents of magnetite in soils of zone A followed by B and C.
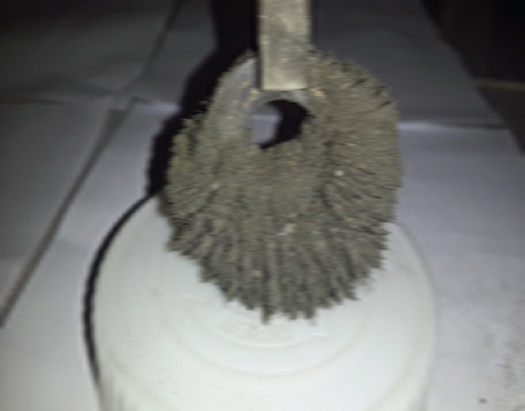
Figure 4. An illustration image of magnetic force of soils of zone A
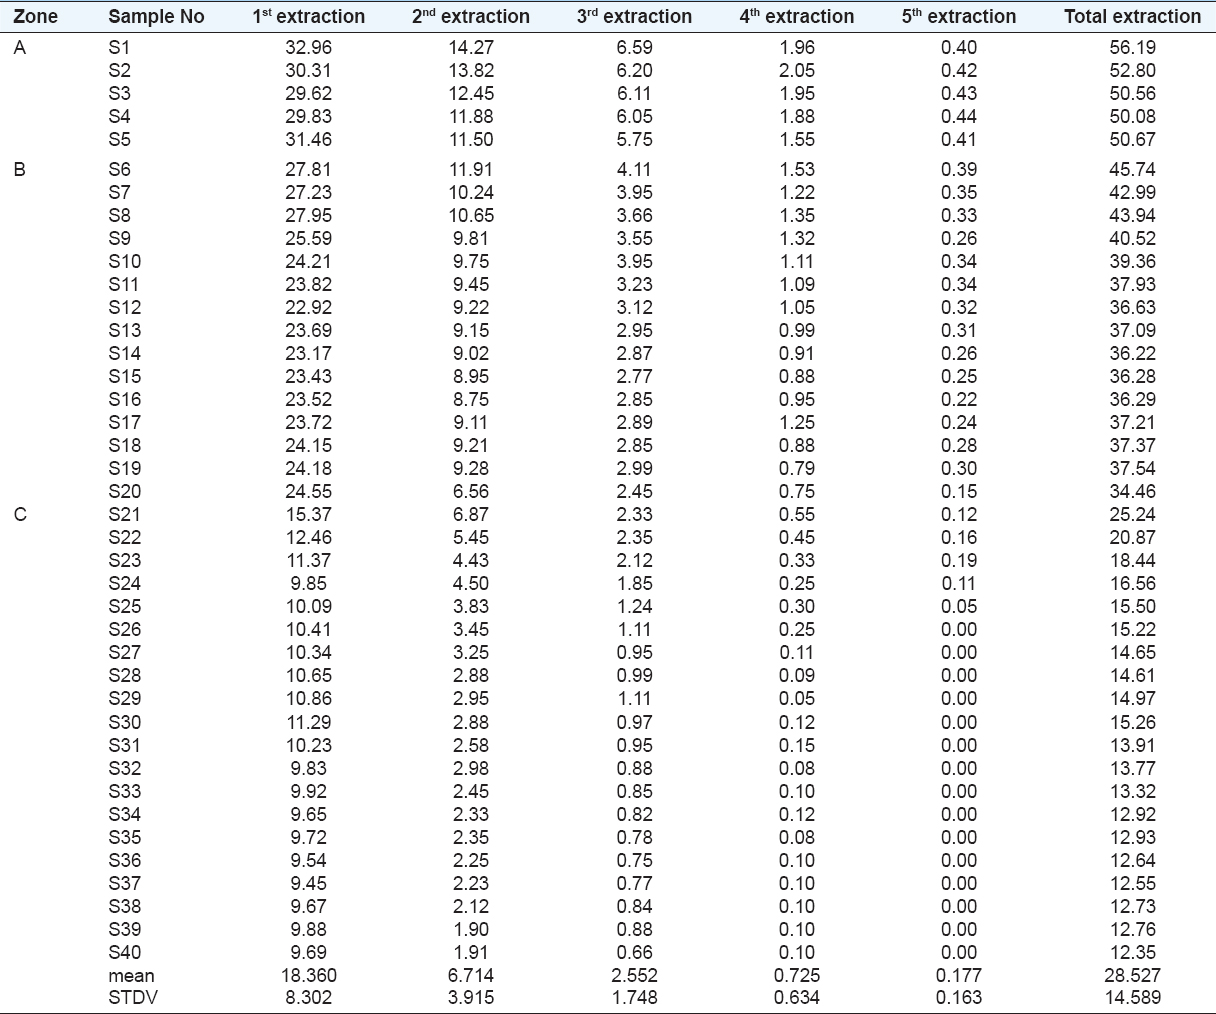
The amount of free iron oxides after five successive extractions with aqua regia (Feaq) is shown in Table 2. The average values of digested Fe oxides of the soils of zones A, B, and C were 52.1%, 36.8%, and 15.1%, respectively [Figure 5]. Kafoor and Mawloud (2015) stated that magnetite Fe3O4 was the dominant Fe oxide followed by hematite and wustite. They also stated that the method by Mehra and Jackson (1960) was not effective enough to extract total free Fe oxides of Asnawa soils; therefore, five successive extractions with aqua regia solution were applied until the solutions became clear of Fe.
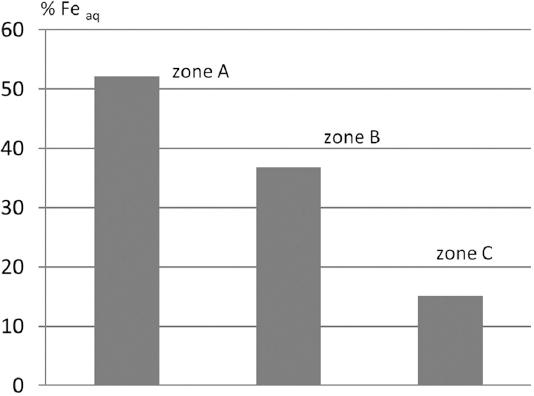
Figure 5. Feaq% (by wt) in the soils of zone A, B, and C
Table 2: Total amount of Fe oxide (%Wt) extracted by Aqua Regia after five successive extraction
Many researchers concluded that color which is measured visually can be used to identify and quantify soil Fe oxides (Mirabella and Camicelli, 1992; Schwertmann, 1993; Torrent and Baron, 1993). In this study, the formula by Torrent and Barron (2003) was modified and a new equation was derived. A relationship between CI and concentrations of Fe oxides extracted by aqua regia solution (Feaq) was studied. The derived formula; (10–H) × V/C.
Where H is the number preceding YR in the Munsell hue, V is the value, and C is the chroma. Relationship between color intensity (CI) and Feaq was studied. A very high correlation (r = 0.956***) was found between CI and Feaq [Figure 6]. The gradient of the relationship is close to 1, and the regression line passes close to the origin indicating that Fe oxides which are widely known as having high pigmenting power are responsible for pigmenting the studied soils. Consequently, in this investigation, it can be concluded that the amount of Fe oxides in the soils can quantitatively be predicted when the formulae (10–H) × V/C is applied. Torrent and Barron (2004) mentioned that soil color measured by visual methods can be used to identify and quantify soil Fe oxides. In their study, a good relationship was reported between redness rating and hematite content.
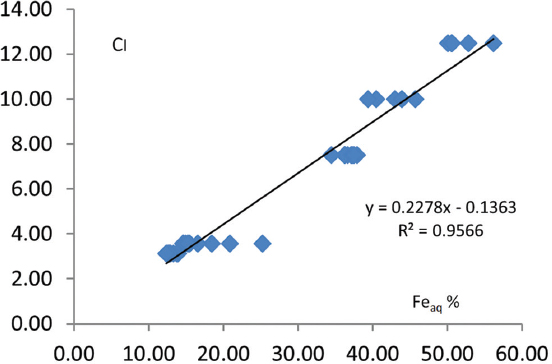
Figure 6. Correlation coefficient and regression equation between Feaq% and CI
4. CONCLUSION
In this investigation which was carried out on soils of different zones in Asnawa area, the highly significant correlation between the intensity of soil colors and the amount of total Fe oxides that were calculated from the derived formula (10–H) × V/C indicate that color of Asnawa soils can be measured as a parameter to identify and quantify soil Fe oxides.