1. INTRODUCTION
Since Kuznets posited his now famous inequality curve in 1955, the issue of the relationship between inequality and economic growth has troubled economists and social scientists. Normative questions regarding social equity aside, whether or not inequality and growth are correlated and in which direction, if any, causation flows have far-reaching implications for economic and social policy that cannot be ignored. Especially Kuznets’s hypothesis is about inverted-U relationship between two variables, which means using square of the explanatory variable and checking the sign and significance of it. Hence, in this study, we look at the relationship between economic growth and inequality to find answers to these questions. Is inequality an unfortunate but necessary ingredient for growth, or is it possible that equality and growth be compatible or, perhaps, even complementary? Such questions are symptomatic of a broader debate regarding the existence of a trade-off between innovation and equality in general (Okun, 1975).
Simon Kuznets hypothesized that the relationship between growth and pay inequality changes on the basis of the level of development of a country or the degree of industrialization. In the initial phase of development, income diverges as the rural population migrates to the more unequal, higher-wage urban industrial centers. However, as the urban proletariat matures, political institutions that increase the income shares of lower-wage workers are created, and inequality decreases as industrialization deepens (Kuznets, 1955)1. Therefore, for a given level of income (or industrialization), the relationship between growth and pay inequality is assumed to be stable–negative for most countries currently on the downward-sloping portion of the curve.
Although Kuznets hypothesized the effect of growth (or development) on inequality, subsequent literature reversed this causal relationship. Empirical work seeking to confirm or reject the hypothesis put forward by Kuznets has proliferated in recent years, using both pooled and panel data in an attempt to shed light on the relationship across countries and time. Surveying 23 different studies, Bénabou (1996) concluded that initial inequality is detrimental to long-run growth.
Recent work has found that a few rich countries specializing in high-wage, advanced capital goods have experienced a post-Kuznets rise in inequality. While most developing and industrialized countries are found on the downward portion of Kuznets’ inverted U-shaped curve, inequality has been raising with increased income levels in high-income countries such as Japan, United States, and United Kingdom. Conceição and Galbraith (2001) postulate that the original formulation of Kuznets may apply only as long as countries principally produce consumer goods, and may break down as industrial activity shifts to monopolistic, advanced technology goods for the world market. In that case, the richest and most advanced industrial economies producing capital goods for export would be found on an “augmented” Kuznets Curve with an upward-sloping tail for such countries, as shown in Figure 1. However, away from the peak and trough of the augmented curve, the relationship between growth and inequality is presumed to be more or less a stable function of income level.
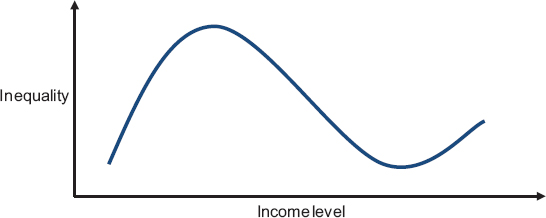
Figure 1. The augmented Kuznets curve
This study examines the relationship between pay inequality, economic growth, and performance in Korea. Pay inequality is estimated using Theil’s index to identify the factors determining the level of pay inequality and establish its relationship with economic growth and performance. The empirical results are based on panel data of Korean manufacturing sector for the period 199–2003. First, we review changes in industrial trend, production, and investment patterns over the period and the manner in which these changes led to the creation of a relative pay inequality among and within regions and sectors. Thereafter, we compare the annual changes in pay inequality in different sectors and annual gross domestic product (GDP) growth, finding that the previously stable and negative relationship predicted by Kuznets broke down at the height of the period of structural reform in Korea, giving way to a positive relationship after 1998. After a brief review of the reforms undertaken during the financial crisis, we will examine the evidence for this change and mechanisms by which it may have taken place. Finally, we conclude with implications and avenues for further research on the topic.
On the basis of Theil’s T-statistics, results indicate a positive relationship between pay inequality and size of a firm, location, R&D, export and industry sectors. The relation holds even when we control for an individual firm, time period, and firm characteristics. The decomposability property of Theil’s index enables us to show that pay inequality in the Korean manufacturing industry has increased both across sectors and regions, although more strongly across industrial sectors. Despite controlling for changes in the level of real per capita income, the rise in inequality accelerates in the period following the introduction of reforms.
The questions raised above are also addressed by examining the relationship between inequality and growth in Korea, and the manner in which this relationship has possibly been affected by the Asian financial crisis. However, space and data limitations allow only for partial inference on to what extent and how it affected pay inequality. It appears that a large portion of rising pay inequality can be attributed to rising relative pay among the small-sized firms, outside the capital city area and in the ICT sectors which were affected by the economic structural reform since 1997. The findings support the hypothesis of an “augmented” Kuznets Curve, according to which certain developed countries are found on an upward-sloping addendum to the original formulation of Kuznets.
This study adds a new dimension to research in this field by showing that the relationship between growth and inequality may change, as it does in the case of Korea, for example, as a result of structural reform. Although the income level in Korea does not change appreciably during the final decades of the 20th century, data on pay inequality in the manufacturing industry indicate that the stable, negative relationship between growth and inequality predicted by Kuznets reverses at the peak of the reform period. The reversed effect implies thrusting Korea into a small group of otherwise wealthy and highly industrialized countries for whom inequality increases with economic growth.
This paper is organized in the following manner. Section II provides a brief introduction on the background of pay inequality and the Korean economy. Section III presents a review of previous studies to understand pay inequality and the Korean industry. Section IV explains and critiques the methodology of Theil’s T-statistic. Section V presents a description of the data pertaining to the Korean manufacturing industry and variable definition. Section VI presents the results and Section VII presents conclusions with suggestions for policy implications.
2. OVERVIEW OF THE KOREAN ECONOMY
As is well-known, in recent decades Korea has experienced dramatic economic development. From being one of the poorest countries of the world in the 1960s, it became a member of the Organization for Economic Cooperation and Development in 1996. The economy has made remarkable progress since the early 1960s, with GNP growth averaging 7.8% per annum between 1961 and 2000. In a relatively short time period, the country was transformed swiftly from a poor traditional agricultural society to a modern industrial country. Comprehensive investment programs in technology and human capital made the manufacturing industry the engine of its economic growth driven by an outward-looking, government-led development strategy pursued from the early 1960s onward. During this process of growth and development, the national government intervened extensively in resource allocation, targeting industries that were to be promoted and provided necessary incentives at different levels for development and progress.
Numerous researchers, including Amsden (1989) and World Bank (1993), chose to study the Korean case as one that could serve as a model for the development of other developing countries; moreover, the Korean economy was believed to be strong. However, the value of the Korean won dropped by 50% between the end of December 1996 and the end of December 1997 when Korea experienced a financial crisis in 1997. The economic crisis of 1997–1998, after three decades of unprecedented economic growth, was evident. The outstanding external debt reached US$159 billion in December 1997, real GDP growth rate declined by 7%, and unemployment rate exceeded 8% in early 1998 from being <3% in the early to mid-1990s. The request by the Korean government for a 3-year stand-by credit from the IMF amounting to approximately $21 billion was approved on December 5, 1997.
Figure 2 indicates the remarkable economic growth despite the economic crisis of Korea during the period (1993–2003), the period under consideration in this paper. Per capita income increased from $8,177 in 1993 to $12,720 in 2003. This period of rapid change provides an extraordinary opportunity for examining the relationship between economic growth and income distribution and mobility in Korea.
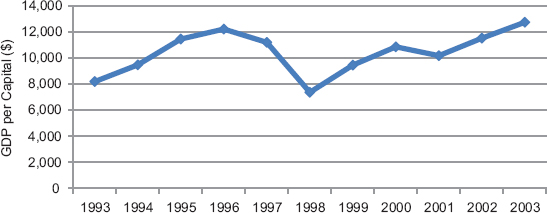
Figure 2. Gross domestic product per capita of Korea, 1993–2003 (in 2000 prices)
Although the Korean economy suffered severely from the Asian financial crisis, it was known for its rapid recovery from the crisis (Yoshitomi, 2003; Koo and Kiser, 2001; Fischer, 1998). However, it can be expected that the impact of the crisis on firms would differ in accordance with the characteristics of various firms. The industrial policies for firms with different-sized classes underwent a dramatic transformation in the post-crisis period. As a result of the recovery policy, large-scale enterprises (LSEs) succeeded in necessary downsizing in the immediate aftermath of the financial crisis and grew rapidly in the post-crisis period, particularly in the export market. On the other hand, small and medium enterprises (SMEs) continued to suffer from the effects of the recession and, in particular, in the domestic market (Oh et al., 2008). Consequently, pay inequality increased over the entire industry, and differences with respect to locations and industries were distinguished.
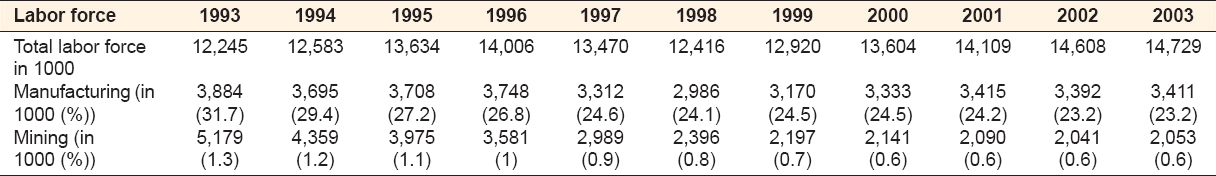
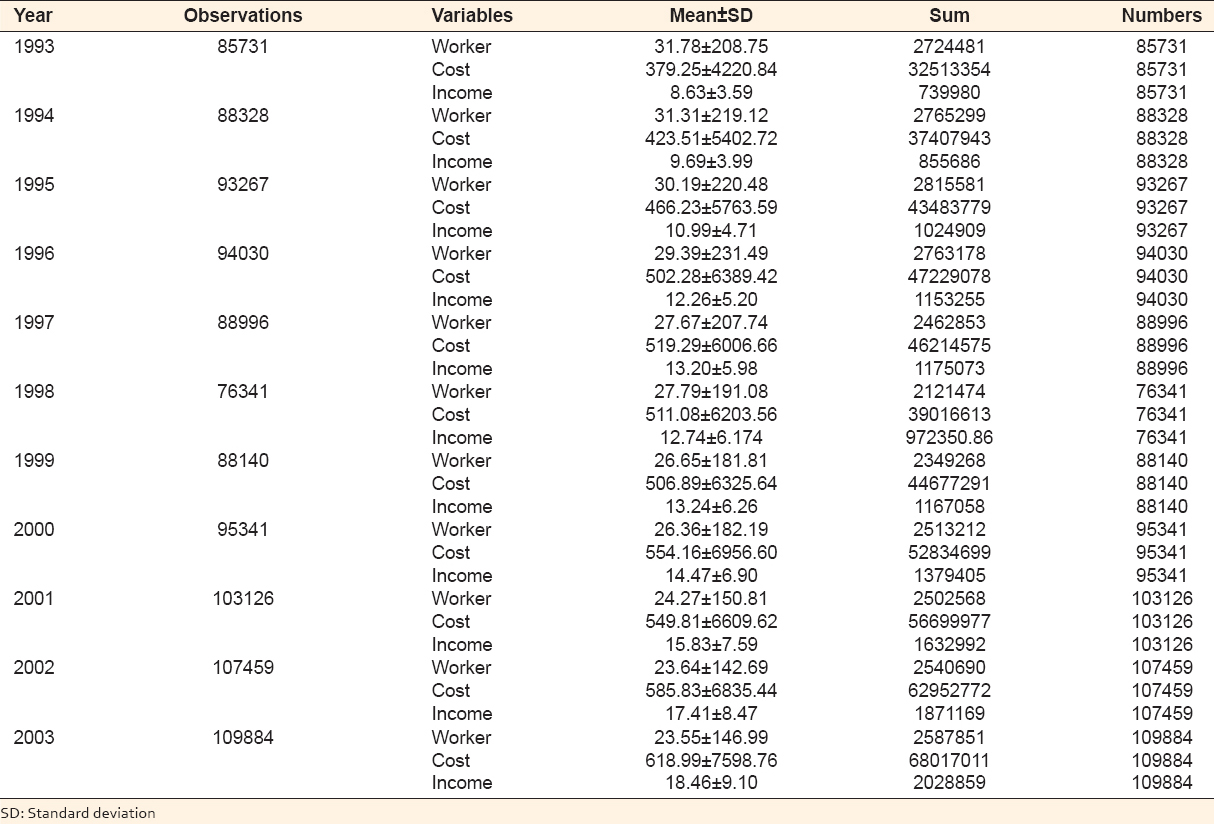
The heterogeneous impact of the financial crisis in the form of increased pay inequality on firms according to their size and location was the motivation for addressing the relationship between inequality and industry growth in the current study. Therefore, this paper examines pay structure and pay inequality between 1993 and 2003 in the Korean manufacturing industry using Theil’s T-statistic. As indicated in Table 1, the manufacturing industry accounts for one of the largest shares of the Korean industry. The dataset is derived from the Annual Report on Mining and Manufacturing Survey in Korea. It includes firms with five or more employees in 580 manufacturing industries classified by the Korean Standard Industrial Classification (KSIC) at the 5-digit level.
Table 1: The development of labor force in Korea and its distribution (in 1000)
Pay inequality can be investigated in terms of the location, size, R&D investment, and export activity and industry sectors of the firm. Further, we evaluate the manner in which the Asian financial crisis and policies for recovery impacted pay inequality. This paper studies the change in pay structure and inequality from a comparative perspective. First, the tendency of a relationship between pay inequality and economic growth between 1993 and 2003 is examined. Second, firms are categorized in terms of industry sectors, locations, and size, and the differences and characteristics are identified. Finally, a comparison is made between the analyzed inequality distribution and economic growth, the position of Korea according to Kuznet’s theory is identified, and the associated implication is obtained.
3. REVIEW OF LITERATURE
Although Kuznets hypothesized the effect of growth (or development) on inequality, subsequent literature reversed this causal relationship. Empirical work seeking to confirm or reject the hypothesis put forward by Kuznets has proliferated in recent years, using both pooled and panel data in an attempt to highlight the relationship across countries and over time. The majority of this empirical work found a consistently negative relationship between inequality and growth, typically based on multivariate cross-country regression models in which inequality is one variable determining economic growth. For example, Birdsall et al. (1995) found that egalitarianism was a key ingredient in the recipe for rapid growth in East Asia. Surveying 23 different studies, Bénabou (1996) concluded that initial inequality is detrimental to long-run growth.
In 1998, Deininger and Squire disrupted the emerging consensus with a study based on their ambitious new global inequality dataset compiled for the World Bank from disparate household surveys of 108 countries since 1950. Based on the new data, Deininger and Squire (1998) found no evidence for the inverted U-shaped curve given by Kuznets. Using the same data and panel specification, Forbes (2000) found that initial inequality leads to higher subsequent rates of growth. However, several authors indicated severe problems with the new data, thereby casting a shadow over conclusions drawn from it. Galbraith and Kum (2002) reveal the manner in which problems with the Deininger and Squire data lead to multiple and contradictory conclusions regarding the relationship between inequality and growth (ranging from an upright to inverted U-shaped curve to positive and negative linear ones). It must be mentioned that the focus in the above-mentioned studies is yet on a unidirectional causal relationship between growth and inequality. For a majority of the countries, the negative relationship appears to remain intact despite questions regarding causality and endogeneity.
There are a number of competing theories that explain the between firm wage dispersion. The efficiency wage theory argues that paying a wage premium may be profitable for firms because high wages can reduce monitoring costs, discourage turnover, attract a higher quality pool of applicants, and foster employee loyalty. Hence, wage dispersion across firms is observed when firms differ in their ability to monitor or motivate their workers, bear the cost of turnover, or measure labor quality. The theory of insider controls provides another institutional explanation for demand-related wage variation. If firms possess product market power and their workers are able to bargain for a share of the rents, cross-firm differences in rents or in the ability of workers to extract rents generate wage differentials among firms.
Although efficiency wage and insider theories explain why wages may be set above their market-clearing levels, their predictions for the impact of a wage premium on firm performance differ. Efficiency wages are compatible with profit maximization because they are intended to increase labor productivity. However, rent-seeking activities of insiders undermine the financial performance of the enterprise because these activities have no effect on worker performance. These competing theories of between firm wage dispersion have been tested empirically; however, the extent to which wage dispersion is attributable to competitive versus noncompetitive factors remains unresolved. In this paper, merely examining the tendency of pay inequality in Korea between 1993 and 2003 and then comparing with sectors and regions provides numerous implications for the industrial policy of Korea2.
There has been a large volume of studies on pay distribution in Korea since the late 1970s. Although estimates of pay inequality differ slightly depending on the data used, a majority of these studies agree that pay inequality increased in the 1990s, particularly since after the financial crisis wealth is far less equally distributed than pay (Lee and Hwang, 1998; Lee, 2000). There is no consensus on the direction of pay inequality over the path of economic growth. The results suggest among others rising inequality (Kim and Ahn, 1987), inverse-U type curve (Choo, 1993), and falling inequality (Kim and Topel, 1995; Fields and Yoo, 2000; Kang and Yun, 2008). Karacaovali and Tabakis (2017) discuss wage inequality dynamics. Several recent studies like Lee (2017) investigate the international trade and within-sector inequality, while Mohseni-Cheraghlou (2016) analyzes the human and social well-being in the aftermath of Asian financial crisis.
Kim and Topel (1995) study the evolution of labor markets in Korea during 1971–1986 when Korea experienced rapid economic growth and structural change. The authors are interested to know how labor market adjusted to structural change and how wage and income inequality change during economic development. The findings are: (i) Advancing productivity drove the transformation, (ii) sectoral neutrality of wage growth and employment, (iii) high sectoral mobility of worker, (iv) high inter-firm mobility, and (v) weak evidence of increased inequality during initial stage of industrialization. In sum, the result here is not supporting Kuznets’s conjecture due to purposeful industrial policy. In a similar study but based on more recent data, Fields and Yoo (2000) show that Korea’s exceptional economic growth was coupled with an even more exceptional fall in labor income inequality. The authors quantify the importance of factors contributing to the fall of labor income inequality. They find that job tenure, gender, years of education and occupation explain the level of income inequality, while years of education, industry, occupation, and experience explain the change in income inequality.
Since in the situation of a financial crisis, certain institutions express interest in enterprises such as the Federation of Korean Industries (FKI) that solicits further flexibility of the labor market (FKI, 2000). It is doubtful whether this argument would be appropriate for the Korean economy, where job mobility has been rather restricted as compared with a majority of the developed economies. With regard to pay inequalities, Stiglitz (1999) admits that pay inequality tends to rise in periods of economic crises, structural adjustment, and output contractions. The increase in pay inequality might be stronger when the labor market is subject to restricted mobility.
Although all available measures indicate widened pay inequalities in Korea during 1997–1999 (Yoo and Kim, 2002) due to the increase in the number of the irregular workers and unemployment rate, interpretations of the situation of pay inequalities since 2000 appear to depend on the survey methods that were utilized. For example, a measure such as the Gini coefficient based on the households of urban workers indicates that the Gini coefficient increased from 0.307 in 1996 and 0.296 in 1997 to 0.311 in 1999; however, it decreased to 0.301–0.303 in 2000 and 2001. This decline is presumably due to increased public transfer and decreased unemployment rate; meanwhile, a majority of other measures indicate that the Gini coefficient has been more or less stable since 1999 (Park et al., 2002; Yoo and Kim, 2002).
However, a majority of previous researchers mainly focus on pay inequality at a point of time measured by certain inequality indices. Although this snapshot view of pay inequality receives attention from the public, it provides little information regarding the nature and direction of pay inequality. Different from previous studies, this paper attempts to analyze pay inequality using Theil’s T-statistic through a comparison with several between and within units. First, this paper examines the tendency of pay inequality with economic growth between 1993 and 2003. This period includes both pre- and post-crisis periods. Second, we divide the data on the basis of industry sectors, firms’ location and size, etc., and then determine pay inequality differences and characteristics. Finally, the effects of firm dynamics on pay inequality will be analyzed in greater detail.
It should be noted that previous studies have pointed that the cause of rising pay inequality are: (i) Skill-biased technical change in the production methods as a result of gross job creation and destruction, employment reallocation, and shift in the structure of labor demand (Davis and Haltiwanger, 1991; Bound and Johnson, 1992); (ii) acceleration of international trade among countries from the supply response to the increased demand that produces increasing wage inequality which ultimately produces increasing equality (Murphy and Welch, 1991) (iii) decline in unionization that lowered earnings differentials across industries and gender (Freeman, 1991). Acemoglu (2002) found that the faster increase in the supply of skills in Europe, the role of Europe’s labor market institutions and investment in education and technologies reduce skill-biased technical change preventing wage inequality from increasing. These are the three most popular explanations for the different inequality trends in the US and UK. Gottschalk and Smeeding (1997) found wage inequality increasing over time and the trend to be different across countries. Countries with centralized wage bargaining are more equal. It is affected by demand for skill, returns to education, experience and institutional constraints on wage. One possible direction of research in this area would be to assess the observed rising pay inequality according to these potential sources. We elaborate with these potential sources, yet a detailed analysis is beyond the scope of this study, and it needs to be treated separately.
As mentioned above, the empirical relationship between economic growth and distribution of inequality hypothesized by Kuznets is unclear, and it follows a country-specific path. Korea is a country that could successfully couple economic growth and pays equality in the period of its industrialization. This is opposed to what Kuznets’s hypothesis predicts; nonetheless, it is believed that factors such as education, industry, occupation, and experience are important in determining the level of inequality over time. Despite this discrepancy between Kuznets and empirical results and the controversy over the direction of pay inequality, we try to locate Korea’s position according to the Kuznets’s curve to establish such a relation. This is justified by the widening pay inequality in recent years and the availability of updated data.
4. METHODOLOGY
Theil’s T-statistic is one of the several frequently used indices of inequality that provides a useful alternative approach to measuring the change in earnings inequality within a single country and to comparing degrees of change across countries3. The method has been intensively used in the analysis of the income distribution of households and individuals. Theil’s T-statistic does not rely on surveys but on the regularly-gathered official measures or register data of income by region and sector. This method is used to compute the between group component of Theil’s T-statistic across province sector cells for both locations and industry sectors. Theil’s T-statistic is a rather simple measure of inequality, relying only on two pieces of information regarding each cell: Its weight in total population (or employment), and the ratio of average income within the cell to average income in the country as a whole.
The following formulae provide the algebraic computation behind Theil’s T-statistic4. While these particular equations use income as the variable of interest, Theil’s T-statistic can address any number of quantifiable phenomena. When household data are available, Theil’s T-statistic is written as:
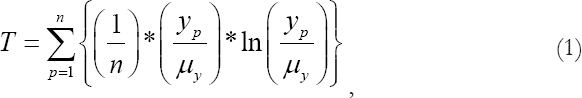
Where, n is the number of individuals in the population, yp is the income of the person indexed by p, and µy is the average income of the population. If every individual has exactly the same income, T will be zero; this represents perfect equality and is the minimum value of Theil’s T-statistic. If one individual has all the income, T will equal ln(n) this represents utmost inequality and is the maximum value of Theil’s T-statistic. Thus, unlike the Gini coefficient, Theil’s T-statistic is not limited to values within the 0–1 interval.
If members of a population can be classified into mutually exclusive and completely exhaustive groups, then the Theil’s T-statistic comprises two components the between group component (T’g) and the within-group component (Twg) that can be expressed in the following manner:

When aggregate data are available instead of individual data, T’g can be used as a lower bound for the value of Theil’s T-statistic for the population. The between group element of Theil’s T can be written as:
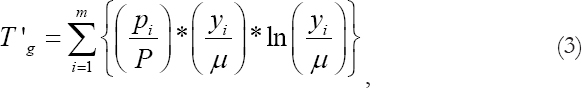
Where i indexes the groups, pi is the population of group i, P is the total population, yi is the average income in group i and µ is the average income across the entire population.
T’g is bounded above by ln(P/pi(min)), the natural logarithm of the total population divided by the size of the smallest group. This value is attained when the smallest group possesses all the resources. When data are hierarchically nested (i.e., every municipality is in a province, and each province is in a country), Theil’s T-statistic must increase or remain the same as the level of aggregation (i.e., Tpopulation T’g (district) T’g (county) T’g (region)). Theil’s T-statistic for population equals the limit of the between group Theil component as the number of groups approaches the size of the population.
Theil’s T-statistic has properties that make it attractive for the type of calculation described above; in particular, it is possible to add row and column elements to arrive at cross-sector and cross-province measures of inequality. It is also possible to look directly at the contribution to overall inequality of each cell, sector or province, and to gauge the yearly change in that contribution. Of course, the general comparison of the Theil index methodology is made by estimating pay inequality for individual persons among countries or regions. However, in this study, we compare pay inequality using firm-level data. Dong (2005) analyzed wage inequality and between-firm age in the 1990s by employing the Theil methodology, in which data of rural and urban firms were used. Galbraith et al. (2004) evaluated pay inequality in 1979–1998 in the Indian manufacturing sector.
5. DATA
In this study, we examine the pay inequality in the Korean manufacturing industry according to the classifications of the sector, region, and firm size from 1993 to 2003. The data used in this study were the unpublished plant-level data compiled from the Annual Report on Mining and Manufacturing Survey in Korea. The data encompasses all manufacturing plants with five or more employees in 580 manufacturing industries at the KSIC 5-digit level. It was an unbalanced panel data with approximately 76,341–103,126 observations for each year.
In the survey data, the entry and exit of manufacturing plants were identified based on their appearance and disappearance over time. Entry and exit of plant due to spin-off, split, merger, and acquisition could not be identified from the available manufacturing plant level database. A total of 300,916 distinct manufacturing plants were observed during the analysis period. As such, the data pertains to entering, exiting, and surviving plants. The data are available at the 5-digit industrial classification level for the entire Korean manufacturing industry.
The total number of observations was 1,030,643. Manufacturing plants that had over 300 employees were denoted as firm size Class 5; when the number of employees was between 300 and 100, the plants were classified as firm size Class 4; when the number of employees was between 50 and 100, plants were classified as firm size Class 3; when the number of employees was <50 and over 20, plants were classified as firm size Class 2; and when the number of employees was between 5 and 20, plants were classified as firm size Class 1. The annual changes in the number of firms, the aggregated firm characteristics, and the number of employees for each group were also described.
The descriptive statistics of the data for each year of observation are reported in Table 2. In addition to the number of observations in each year, the distribution of each variable including the number of workers, cost, and incomes is presented. The number of observations increases over time, while the number of workers declines. The cost and its dispersion display an increasing trend; the same applies to income variables.
Table 2: Descriptive statistics of firm level data over time, 1993–2003
6. RESULTS
First, we examine the relationship of pay inequality with economic growth between 1993 and 2003. We begin by examining the information provided by KSIC data at the 5-digit classification level for Korea as a whole. Figure 3 presents Theil’s T-statistic values resulting from this exercise.
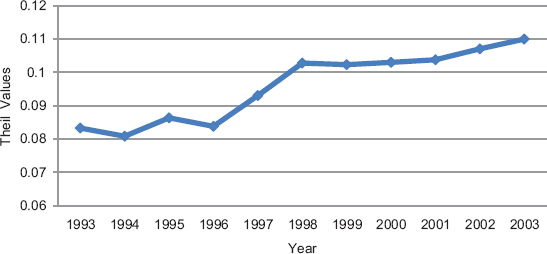
Figure 3. Theil’s T-Statistic measure of pay inequality for Korean manufacturing industry, 1993–2003
It was found that the inequality trend measured by Theil’s T-statistic remained stable and consistent in the early 1990s and that it was declining slightly. However, we observe that the graph upswings sharply in the years 1993–2003 remains fairly steady in 1993–1996, then increases rapidly in 1996–1998. Thereafter, pay inequality in the manufacturing industry remained steady until the years 1999–2003, after which it began creeping upward. This is definitely different from the “augmented” Kuznets’s Curve that indicates that inequality increases with an increase in economic growth levels, as found in the United States, Japan, and the United Kingdom. The Korean economy did not attain the economic level of developed countries the economy was merely reformed and maintained. If the economy had been stabilized and reformed in a proper manner, the inequality should have become similar to that before the crisis or decreased steadily. However, as seen in Figure 3, the inequality increases drastically since the financial crisis. The rather short period of radical economic reform does not result in concurrence of economic growth and inequality but a greater increase in inequality than economic growth. Comparing with 0.005 increasing of the U.S. and 0.01 increasing of the EU 22 countries, a 0.044 increasing in pay inequality in Korea is a quite significant amount between 1996 and 1998. Therefore, certain difficulties, as stated above, can be expected from such a reform and, based on political consideration of these facts, wage distribution and economic development plans must be considered carefully.
To further examine whether inequality in Korea is primarily a geographic or location issue, we aggregate the location sector elements into two distinct categories locations and sectors. The 2-digit industrial classification available at the location level is similar to the 3-digit classification available at the national level. The plants level data are available for 16 categories across five major states for this period of study. The location of plants can help in explaining the rising pay inequality through several channels such as differences in education, skill, labor productivity, demand and supply of labor, export activity of the firms and differences in the development of consumer and producer prices, as well as differences in tax rates.
As explained above, there exists (i) inequality across sectors within states, (ii) inequality across locations, (iii) inequality across locations within sectors, and (iv) inequality across sectors. Through this trend of Theil values, we find that in this data, inequality has been steadily increasing after 1997 when the Korean economy faced financial crises; moreover, in the 2000s, pay inequality continued to increase, taking a sharp jump in the final year of observation to levels much higher than in the early 1990s. Thus, a temporary law for fostering venture business was enacted in 1997, and the government intervened strongly in the entire process of certification and support for specific sectors. As a result, the pattern suggests that the regional element of inequality in Korea began to rise before the purely sectoral increases became pronounced and also before major economic reforms occurred. The next issue that is examined is which of the specific firm sizes, regions, and sectors have contributed the most to rising inequality. We first examine the contribution of individual states to the Theil index. Figures 4-6 below present this information.
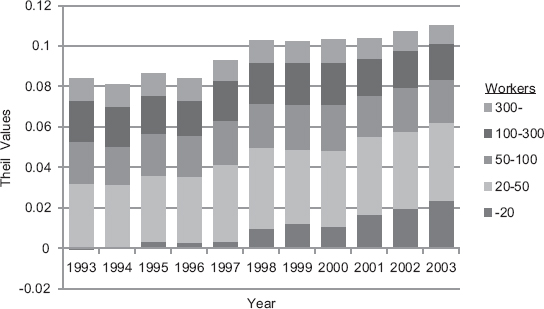
Figure 4. Pay inequality in the Korean manufacturing industry by firm size, 1993–2003
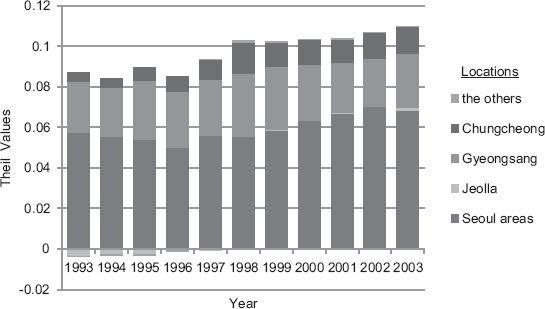
Figure 5. Pay inequality in the Korean manufacturing industry by location, 1993–2003
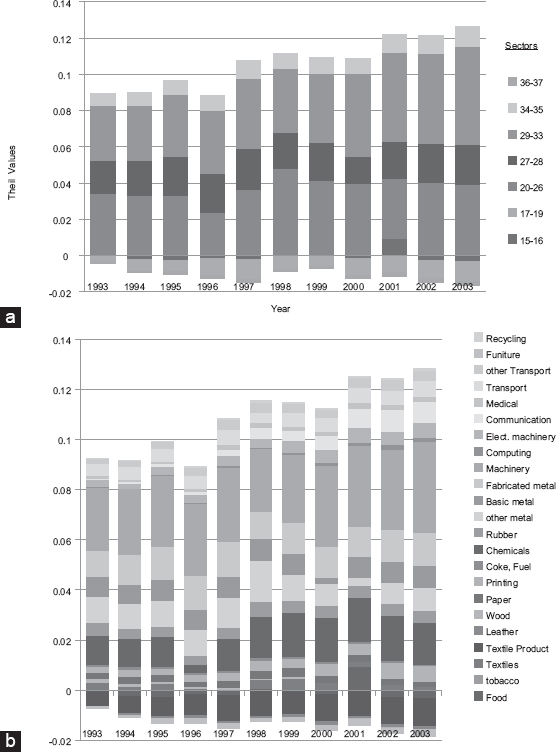
Figure 6. (a) Pay inequality in Korean manufacturing industry sectors at the aggregated 2-digit level, 1993–2003. (b) Pay inequality in Korean manufacturing industry sectors at the disaggregated 2-digit level, 1993–2003
Figure 4 presents the contribution of firm size to pay inequality in Korea firm sizes divided by the number of employees. There are a total of five defined firm sizes, and the categories of the number of employees of the firms are 5–20, 20–50, 50–100, 100–300, and over 300. Firm sizes whose pay rates exceed the average constitute elements above the zero line, while states with pay rates below the national average constitute elements below the zero line. The size of the component attributable to each region and firm size represents the combined influence of labor force and relative income, and it is the change in these influences that is highlighted in the figure. The firms are ranked by the size of their contribution to interstate inequality in the first year under observation.
It is evident from the above figure that the pay inequality of small-sized firms has increased rapidly since 1998. This result, which is related to the industrial policies for firms with different-sized classes, changed dramatically in the post-crisis period. As a result of the recovery policy, LSEs succeeded in the necessary downsizing during the immediate aftermath of the fiscal crisis and grew rapidly in the post-crisis period, particularly those firms that specialized in the export market. In the case of LSEs, their contribution did not change even with the increase in overall equality. On the other hand, the contribution of SMEs increases with an increase in the entire inequality. It is indicated that SMEs account for a considerable amount of the position. Nevertheless, the fact that their contribution has increased since 1997 indicates that SMEs were continuing to suffer from the effects of the recession, particularly in the domestic market. The impact of the economic crisis on SMEs was of greater severity. As an indication of this problem, the number of SME bankruptcies in 1998 reached 22,800, while it was 11,600 in 1996 (Gregory et al., 2002). The short-term debt in foreign currencies, which was a major factor in causing bankruptcies in certain industries, resulted in a series of bankruptcies over the entire economy.
Figure 5 presents the contribution of regions to pay inequality in Korea. Location is divided into five areas: (1) Seoul areas, (2) Gyeongsang, (3) Jeolla, (4) Chungcheong, and (5) other areas. Seoul areas and Gyeongsang make the largest contribution to inequality during the entire period. This is a surprise as it is the most advanced industrial area in Korea and all the leading industrial houses have established manufacturing facilities in these regions. Labor in the Seoul areas is also highly organized; therefore, almost all industrial groups in the Seoul areas and Gyeongsang have pay rates that are above the all-Korea average level.
An examination of the negative Theil elements reveals that pay rates in two of the areas have changed rapidly. A negative element is suggesting that the Theil elements are under the average of the Theil statistics. The pay rates of Jeolla and the others fell below the national average in certain periods. This could be primarily due to the lack of large enterprises from either public or private sectors in these two states. A majority of the industrial establishments in these areas are rather small and belong to traditional sectors like food processing.
Finally, a majority of the smaller states make either no contribution or make a small negative contribution to the Theil index. The smallness of their contribution in absolute value is indicative of their low weight age in the overall employment in the Korean manufacturing industry. The increase in Theil index from 1997 is primarily attributed to an increase in the Theil element for generation of electrical energy, distribution of electrical energy, manufacture of computers and computer-based systems, manufacture of general purpose non-electrical machinery, and manufacture of motorcars. These sectors are specialized in both the domestic and export markets.
All the sector areas obtained a boost after the liberalization of policies regarding production capacities and industrial licensing. It can be inferred from this evidence that one effect of the reforms was to strengthen the market position of those sectors that were already comparatively strong but heterogeneously so; thus, this increased the dispersion of pay in the manufacturing industry across Korea as a whole since the Asia Crisis. Figure 6a and b indicate, in aggregate and disaggregate forms, respectively, the distribution of 2-digit enterprises such as basic metal industries, rubber, plastic, petroleum and coal, and electricity generation and distribution, as well as the large-scale modern enterprises such as chemicals, transport equipment, and machinery, and equipment. These are the major winners and contributors to the income inequality in the manufacturing industry. Manufacturing sectors such as 29–33 and 20–26 are the long-standing losers. Of particular interest is the increasing contribution of the Theil element in the electricity sector over the years, particularly as the sector has become deregulated and increasingly able to assert its monopoly power. Undoubtedly, the increase in the strength of the power sector is the single largest and perhaps the only significant contributor to the increase in inter-sectoral inequality in the Korean manufacturing industry under economic reform.
As seen in Figures 7 and 8, the inequality of firms evolved over time depending on the aggregate R&D and export activities of firms.
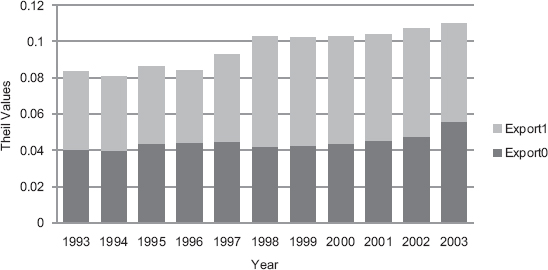
Figure 7. The evolution of inequality over time by export activities (Export0 = Non-exporter, Export1 = Exporter), 1993–2003
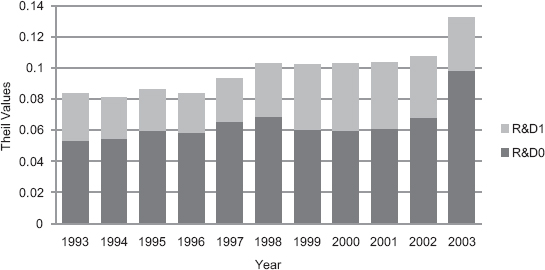
Figure 8. The evolution of pay inequality over time by R&D investment (R&D0 = Non-investor, R&D1 = Investor), 1993–2003
After reforming the structure of the economy, the inequality shares of the exporting group of firms have increased slightly. However, the increase in inequality for the export-oriented group led the fostering policy of the economy to concentrate on the recovery of financial deprivation through trade.
Figure 8 reveals that the increase in the pay inequality influenced the R&D investment of firms. In particular, the inequalities of R&D-intensive firms have increased since the financial crisis of Korea due to the SME-fostering policies of the Korean government, in the post-crisis period, supported and financed venture businesses. On the other hand, the inequality rates of firms not conducting R&D show no variation before and after the crisis period. Instead, their inequality has increased more since the economy became stable.
7. CONCLUSIONS AND POLICY IMPLICATIONS
Since the financial crisis of 1997, there has been an increase in structural reform in Korea. A higher pay inequality is attributed to relatively large-sized firms, capital region, R&D–oriented firms as well as those in high technology manufacturing industries. These firms products were increasingly oriented toward the external market underwent a transformation. Using datasets pertaining to 1993–2003, these paper analyzes pay inequality in the Korean manufacturing industry according to the firms’ location, size, R&D investment, export activity, and industry sector. In addition, we evaluate the manner in which the Asian financial crisis and policies for recovery impacted pay inequality.
First, this paper examined the relationship of pay inequality with economic growth between 1993 and 2003. Using Theil’s T-statistic, it is shown that the overall pay inequality increased and the persistent component of economic growth dominantly shapes the overall pay inequality. We can safely conclude that inequality in the wages of the Korean manufacturing industry has increased since 1996: Both aggregate measures for Korea and different locations agree on this aspect. However, the Korean manufacturing industry retains a large number of the characteristics of a planned and dual economy, with a strong influence of the firm structure on relative wages and their distribution.
Second, industry sectors, firms’ size, and location were identified, and then their differences and specific characteristics were established. The result indicates certain patterns of pay inequality among industrial sectors, locations, and firm size classes. We found a positive and significant relationship between pay inequality and firm size, regional location, R&D investment, export activity, and industry sectors. This holds even when we control for unobservable and observable individual firms, time periods, and firm characteristics. The decomposability property of the Theil index enables us to reveal that pay inequality in the Korean manufacturing industry has increased across sectors, size classes and regions, although more strongly across industrial sectors and size classes.
Finally, we compared the inequality distribution with economic growth and located the position of Korea according to Kuznets’s theory and obtained the related implication. It was indicated that the increase in inequality accelerated in the period following the introduction of economic reforms, after controlling for changes in the level of real per capita income. It appears that a large portion of rising pay inequality in the manufacturing industry in the post-reform period can be attributed to rising relative pay in the large high-technology industry sectors located in the capital city areas. The findings support the hypothesis of an “augmented” Kuznets Curve, according to which certain developed countries are found on an upward-sloping addendum to the original curve. Inequality is indispensable to economic growth, yet Korea experienced an extremely rapid change in the inequality and industrial structure. While a majority of the developing and industrialized countries are found on the downward portion of Kuznets’s inverted U-shaped curve, inequality has been raising with increased income levels. This phenomenon is observed in high-income countries such as Japan, the United States, and the United Kingdom. However, since Korea is not such a high-income country, the share and rate of change in inequality must be monitored to keep it at a low and stable level. The policies must be designed such that their implications are sought and desired.
From the viewpoint of the size of firms, the inequality in firms with 5–20 employees increased rapidly, considering the total share of the inequality. As compared with that before 1996, pay inequality in small-sized companies relatively worsened, which gave rise to lowering the activities of companies and an increase in their risk. Therefore, a Fair Standard Act Policy like the minimum wage system, which can preserve the initial satisfaction of labor supplements, is required to enable resolving the issue of pay inequality. However, the effects of minimum wage will depend on to what extent workers are affected. The effect will be stronger if a substantial portion of the workers is earning around the minimum wage level in the data. In order for corporate tax policies targeting SMEs to be effective in the direction of decreasing pay inequality, they must be accompanied by a necessary mechanism to ensure such effects.
From the geographical perspective, the pay inequality in the Seoul areas and Gyeongsang continued to contribute a large portion to the total inequality, and, in particular, that of Seoul has considerably risen since 1997. Thus, firm-aiding policies, including tax reform and subsidy policies might be required to reduce the inequality gap among different areas. In addition, overall inequality of fabricated metal, chemicals, electrical machinery, and communication industry was found to rise. This indicates the fact that support policies in accordance with the features of each industry are required to reduce and finally eliminate pay inequality.
In summary, this paper presented various aspects on the recent rising pay inequality in Korea. Although pay inequality has been increasing in the manufacturing industry since 1997, particularly following the formal initiation of reforms, this increase cannot be accounted for strictly by increasing average incomes. The rise in inequality persists even when changes in average income among regions is fully controlled for. The crisis moved the Korean economy from domestically oriented to an internationally oriented economy. Thus, the rising pay inequality may be attributed to international trade and globalization. Since globalization affects industries with different degrees, the between industry pay inequality becomes more dominating than within industry pay inequality. Differences in industries’ exposure to international market alow to statistically test the strength in the correlation between pay dispersion and quantitative measure of globalization. In a separate study, we will investigate the relationship between firm dynamics and pay inequality in the same period. This will allow for estimating the effects of the characteristics of firms in terms of entry, exit, and organization structure on the level and development of inequality in pay. In addition, we will also analyze the causes and consequences of pay inequality in a more systematic and economic way, and then we will be able to suggest policy implications more precisely.