1. INTRODUCTION
There is undoubtedly prolific research and debate as to whether a large class size may have any bearing on student achievement,There is undoubtedly prolific research and debate as to whether a large class size may have any bearing on student achievement. This applies to schools, e.g., (Blatchford, 2003) or even in higher education. Some of these studies indicate a negative effect of class size on student performance and satisfaction according to the studies of Kokkelenber et al., 2008, and Mandel and Sussmuth, 2011, while according to the studies of Chapman and Ludlow (2010), Johnson (2010), and McDonald (2013), other studies such as the arguments by Biggs (1998), Ceci and Konstantopoulos (2009), and Rotherham (2011) do not indicate an indifference.
The influence of class size on the university students’ performance has long been a subject of interest. While it is generally believed that, in a small class, there is more student-teacher interaction and thus more effective learning than in a large class (Tseng, 2010), Toth and Montagna (2002) in an analysis of literature from various studies on the subject discovered that there were mixed results; some of them indicate a positive relationship while others indicate the contrary.
1.1. Institutional Context
In the past few years, the university (whose name shall remain anonymous) has undergone tremendous change. One such fundamental change has been occasioned by the shift from being a specialist, elite higher education provider to a more expanded enrollment with a sort of “open arms” admissions policy. At inception in 2006, the original mission was for the university to act as the Center of Excellence in its region and to offer specialist social science training, an area that had been identified as lacking capacity at the time. So to start with, only four undergraduate programs were launched: in Politics and International Relations, Business and Management Sciences, Sociology, and Computers Applied IT. Besides this, there was also a compulsory Access Program, a 2-year preparatory program where all the students enrolled were expected to undertake a 2-year intensive training in English, communication skills, and life skills in general. After the 2-year Access Program, the students would then progress to their respective undergraduate programs. The admission process was also very rigorous, with applicants having to undergo aptitude tests and all that. In the first admission year, only 100 students gained entry out of a large pool of up to 600 or so applicants. They would then be distributed to the four programs. In casual interview with one of the former lecturers, he thusly said: “I had the privilege of teaching some of these students, having been with the university since 2009, and admittedly the quality and caliber of students then was quite remarkable. I believe most of my colleagues had the same opinion on this lot” (Anonymous, Interview, May 10, 2015).
First forward to a few years later, there came a new policy to gradually increase the enrollment. Understandably, this was meant to build a critical mass for the impact of the programs to be felt and also to secure the future of the university. Hence, year by year, the enrollment went up from 100 to 180 and then double to 360. That is not all, it went up further to 450 and ultimately to 600 currently. The number was considered quite staggering, given that the facilities have not been extended commensurately and we are still based on the same old and small campus that was meant to host fewer students.
Other changes that were effected over the years included the abolition of the Access Program and extended the duration of undergraduate program from 3 to4 years.
1.2. Statement of the Problem
Against the aforementioned backdrop, in the first semester of the academic year 2014–2015, the undergraduate year two students took a module “Principles of Marketing.” It was such a “large” class of up to 81 students put together. Throughout the semester, the lecturer reported that he had to contend with a lot of challenges that come with managing such large groups of students, including lack of concentration by students and other behavioral issues. As one would expect, the overall student performance was also not quite satisfactory. Taking cognizance of this, in the second semester, it was resolved within the department to split the class into three groups as a necessary intervention.
This study, therefore, was intended to study the effect of this intervention on the students’ overall performance in the second semester.
1.3. Research Question
The central question in this research was:
-
Is there any relationship between the class size and students’ overall academic achievement?
Answering this question was pivotal in proving the case for small class sizes or otherwise.
1.4. Hypothesis
If x = marks in semester one, before the class is split, and y = marks in semester two, after the class has been split, and the respective means are µ1 and µ2, the relevant hypothesis in this study is:
H0=µ1=µ2 (population means are equal, i.e., there is no relationship between class size and class performance).
HA = µ1≠µ2 (population means are not equal, i.e., there is a relationship between class size and class performance).
1.5. Scope and Limitation
A key assumption of this study is that citeris paribus only class size may influence student achievement. Like most empirical research on class size which utilizes outcome measures such as final course grades, standardized test scores, or other course evaluation data (Johnson, 2010), other factors that may also comprise learning achievement are often ignored. However, arguably, like in this instance, course offerings at different intervals may not be exactly the same thus raising concerns as to whether we might be comparing “apples” with “oranges.”
1.6. Class size: What is Small or large?
This is the question that has perhaps been asked so many times. Hence, what makes an appropriate class size and when would a class be considered too small or too large to be meaningful?
Class size even though often confused with the staff-student ratio (SSR) means quite a different thing and is used to refer to the actual number of learners taught by a teacher at a particular time as compared to SSR which may include even staff with other roles outside the classroom (Ehrenberg et al., 2001).
In some countries or institutions there may be legislation or policy on maximum class size especially in schools. For example,in Norway there is the rule of 30 students (Bonesronning, 2003), whereas in the US it varies from state to state, where for some it is15, while others have it at 17, yet others at 20 (Ehrenberg, Brewer, Gamoran, & Willms, 2001). In our university there has not been any policy of sorts and the interventions might as well be considered just ad hoc by the department.
According to Maringe and Sing (2014), there is generally no well-accepted definition of what a typical large class is even though they indicate that most empirical studies in this area tend to put at classes with more than 100 students based on evidence drawn from such classes.
While larger class sizes present economies of scale and opportunity for increased revenues, especially in the light of economic realities in recent years, it is not an easy choice either. Stakeholders such as higher education administrators are faced with a dilemma as to how to maintain and enhance their institutional reputation through small student-to-faculty ratios among rising education costs. Students too are known to consider class size in their choice of university, study programs, and courses (Westerlund, 2008; Bedard and Kuhn, 2008).
2. RESEARCH METHODOLOGY
To tackle the research question, the study employed a quantitative design utilizing two data sets, i.e., students’ marks in semester one as a large group before the split and the marks in the second semester after the split. The data were then analyzed using the paired t-test, a technique usually used when dealing with two samples that are dependent (Rosner, 1982; Yang and Tsiatis, 2001), like in this case, where each instance in one dataset has a unique connection with the other data set. The samples from the data sets are drawn at random. The following formula is used to determine the sample size:
n=(Z-score)² * StdDev*(1-StdDev)/(margin of error)²
=68
Where:
Margin of error = 5%
Confidence level = 95%
Population size = 81
The theoretical base in the study revolved around the two dimensions of class size and students’ academic achievement. To accomplish a systematic review of literature, Creswell’s (2002) five-step process was applied: “…identifying terms to typically use in your literature search; locating literature; reading and checking the relevance of the literature; organising the literature you have selected; and writing a literature review” (p. 86).
2.1. Ethical Issues
The study and all its aspects had to be subjected to strict ethical guidelines and standards. For purposes of confidentiality, the institution has been anonymized instead of using the actual name. The identities of any of the participants have also not been revealed.
3. DATA ANALYSIS AND DISCUSSION
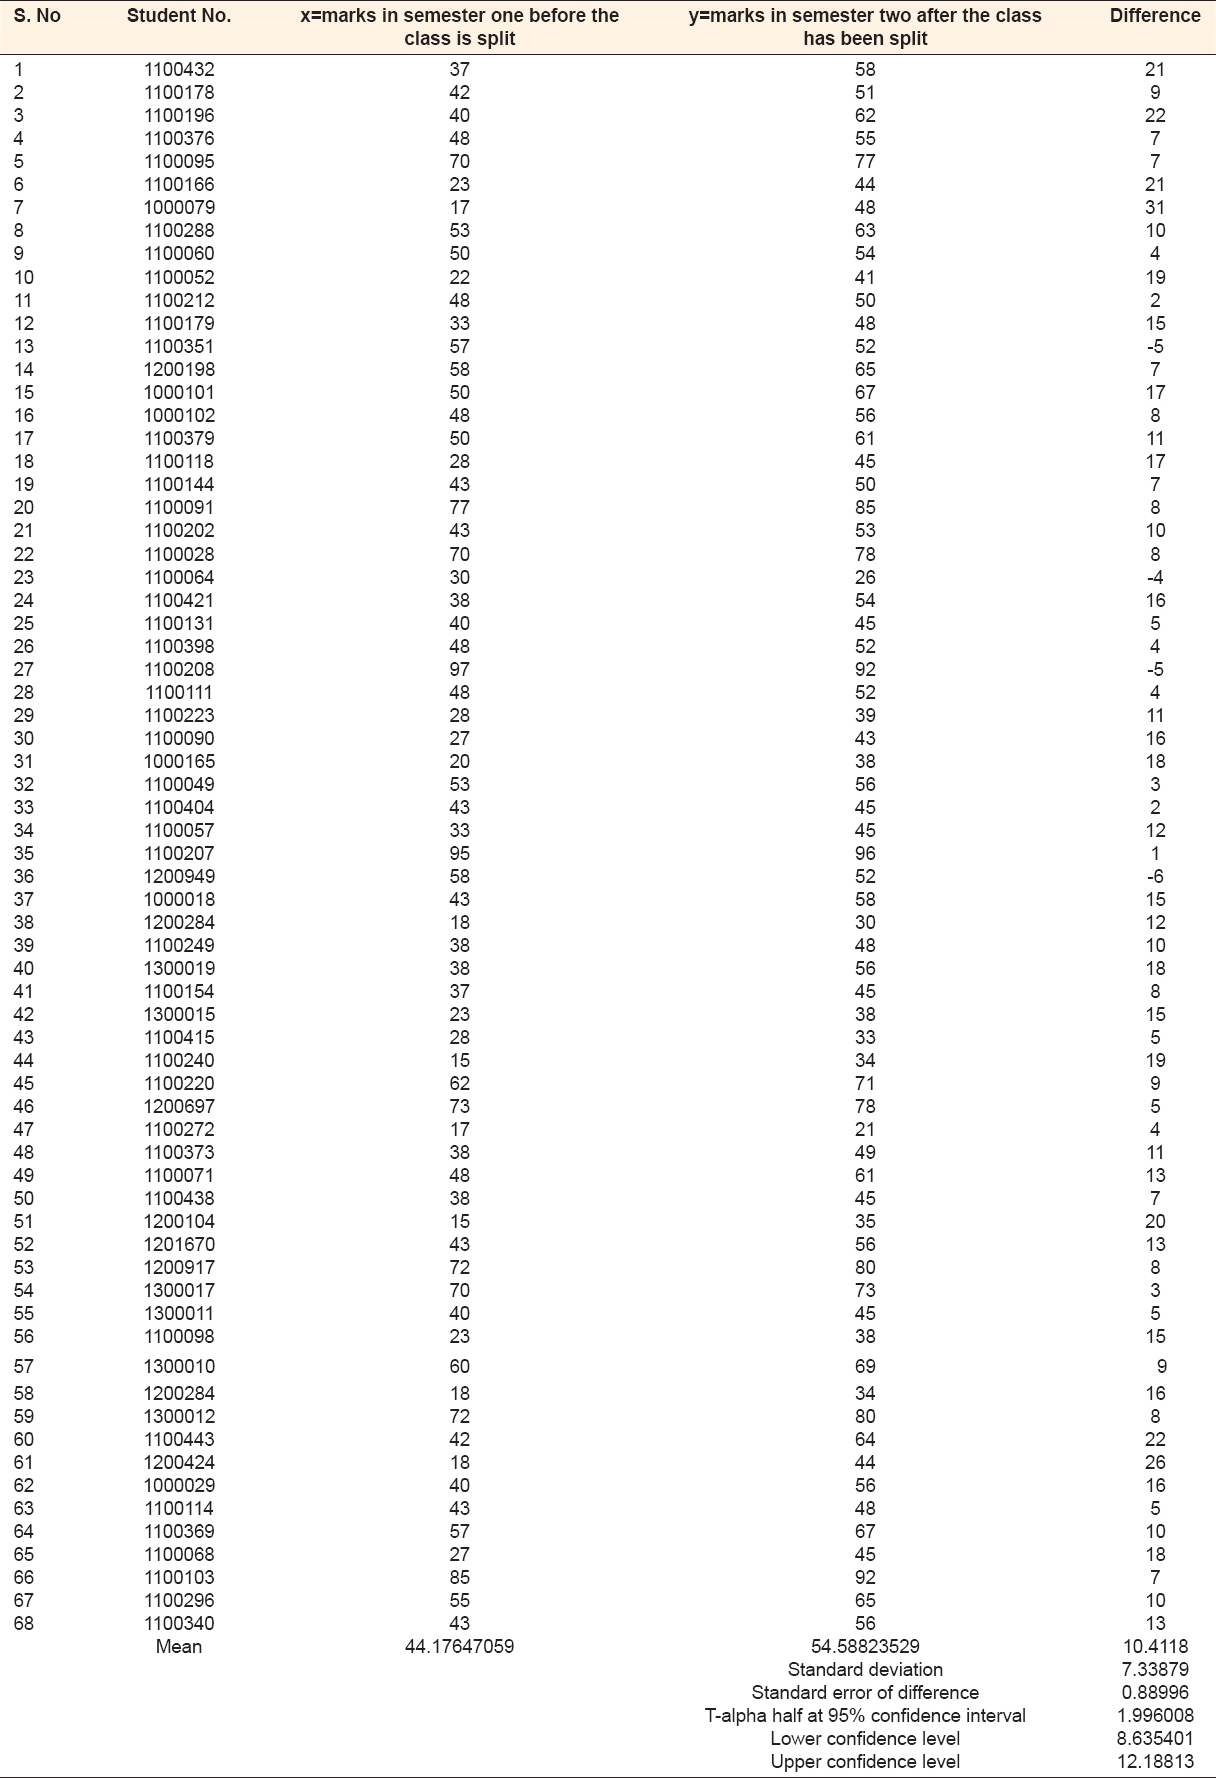
Table 1 shows the raw data for the samples and the analysis performed thereon.
Table 1: Raw sample data and calculation
3.1. Hypothesis Test
The paired t-test is used here to compare one set of data(x) with a second set(y) from the same sample. It is used to compare the “pre” and “post” student scores of splitting the class and to determine whether any change might have occurred.
The formula is presented below.

Where:
- is the mean of the change scores,
Δ - is the hypothesized difference (0 if testing for equal means),
s - is the sample standard deviation of the differences, and
n - is the sample size.
While the degrees of freedom is n=1.
Using Microsoft Excel to perform the calculation, the result in Table 2 is derived. The two-tailed test is pictorially presented in Figure 1, indicating that there is a significant difference between the means with probability distribution for a 95% confidence level.
Table 2: t-test: paired two sample for means
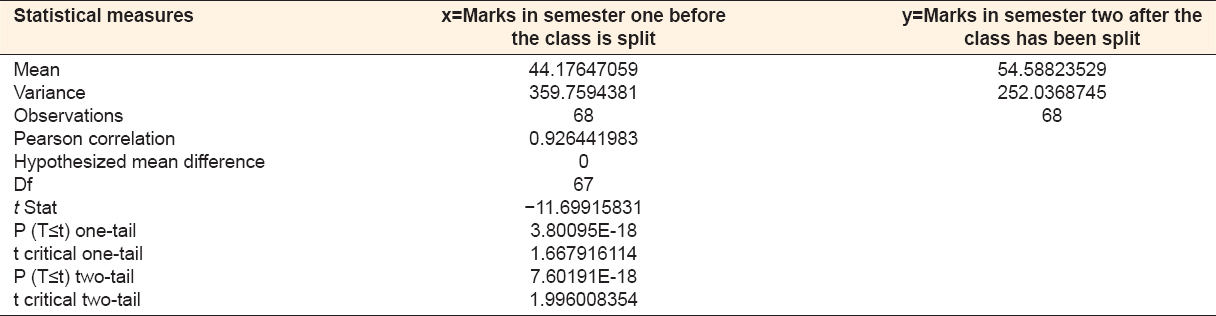
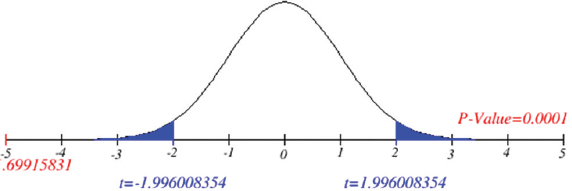
Figure 1. t distribution
A negative sign t stat (−11.699) implies that the sample mean is less than the hypothesized mean. This presents a compelling evidence against the null hypothesis.
It, therefore, affirms the alternative hypothesis that there is indeed a relationship between class size and student achievement.
CONCLUSION
Evidently, from this study, it can be derived that there is a positive relationship between class size and student achievement. Therefore, the contention that class size has no relation with student achievement (Ceci and Konstantopoulos, 2009; Rotherham, 2011) is debunked. However, one key assumption of this study is that citeris paribus only class size may influence student achievement. Practically, there may be several factors that may also come into play inter alia student motivation, learning facilities, teacher’s competency, subject complexity, and so on. These have not been considered or explored in this instance. At the same time, the study only serves to establish the efficacy of small size classes but does not establish how small is best. As author Gladwell (2013) puts it, there is definitely a point below which being small may not produce any better outcomes but may instead produce even worse outcomes.