1. INTRODUCTION
The economic growth engine of any nation is mainly driven by population growth, capital accumulation, and productivity increase. The latter is the most enchaining factor of the growth. Although the economic growth of developed countries has been slowing down since 1973, the Asian countries, especially South Korea, China, and India, have witnessed economic prosperity since then.
For example, the high growth rate of the South Korean economy continued since the 60s till 1997 with its per capita gross domestic product (GDP) of 10,000 USD. However, its economy encountered a monetary crisis in late 1997. As a result, its GDP has decreased by 6.7% in 1998 and around 40% of contraction in its fixed investment. Despite these difficulties, the South Korean economy has recovered after a short period of time and the crises ended in 2001 (Borensztein and Lee, 2002; Khayyat et al., 2016; Oh et al., 2012).
The growth process of countries does not follow a homogeneous movement, and this heterogeneity in growth is evident when comparing the economic growth rate among the developed countries.The period between 1913 and 1950 has witnessed exceptional events such as the two world wars and the prolonged depression, in which, the growth heterogeneity may be attributed to (Kolluri et al., 2000).
It is argued that latecomer countries may witness a rapid growth during their modernizing stage, as they have the opportunity to sponge technological advance from the early comers. Accordingly, countries such as West Germany, Italy, and Japan after the World War II have enjoyed relatively a high economic growth rate. Latecomer countries may overcome some of the economic development stages that early comer countries had to go through (Sofroniou, 2017).
Sluggish increase in the annual growth rate may have a noticeable impact on a country’s economy due to the power of compound interests. For example, the UK’s GDP has been affected and adjusted by the 1.97% annual average inflation increase during the period of 1830–2008. A 0.8% annual growth rate in China between 2000 and 2010 doubled its GDP within 10 years (Judson and Orphanides, 1999). Thus, even small differences in the rate of economic growth among countries will result in differences in a nations’ standards of living.
The aim of the current study is to investigate whether physical and human capital accumulations act as two main drivers of economic growth, measured by per capita GDP. To do so, a panel data of 17 Asia-Pacific countries are studied, and the countries are Australia, Brunei, Cambodia, Hong Kong, India, Indonesia, Japan, Malaysia, Mongolia, Myanmar, Nepal, New Zealand, Philippines, Republic of China, South Korea, Thailand, and Vietnam. Other factors such as Research and Development activities, macroeconomic environment, trade openness, and well-developed financial markets will be included in this research to study their effects on raising the living standards in the group of countries under the study.
The rapid economic growth of the East Asian countries served as a role model for other countries. They became the center of focus for empirical growth studies. For example, a strand of literature has studied and identified the determinant of economic growth and attributed the East Asian miracle to the export-oriented industrialization policy (Amsden, 1991; Ariff and Hill, 2010; Gereffi and Wyman, 2014; Kaplinsky and Morris, 2008; Sawyer et al., 2010; Stubbs, 1999). Another strand of studies has focused on the effects of human capital in the form of education on economic growth (Chen, 1997; Cohen and Soto, 2007; Collins et al., 1996; Kim and Lau, 1994; Krugman, 1994; Yan and Yudong, 2003).
Previous studies have proved that human capital accumulation is the main source of economic growth. Economists such as Theodore Schultz advocated that investment in education to promote human capital is the major source of total factor productivity (TFP) (Schultz, 1961b). Human capital accumulation has been the center of focus among scholars since the evolvement of the growth theory in the 1950s (Barro, 2013; Hanushek et al., 2008; Machlup, 1970; Schultz, 1961a). The education sector in East Asia has experienced a noticeable development during the past two decades. Visible signs of rapid education development in East Asia are universal primary education and rapid increase in secondary and tertiary school enrolment rates (Permani, 2009).
The remainder of this paper is organized as follows. Section 2 reviews the relevant literature and Section 3 presents data sources and model specification. Section 4 provides the estimation result by correlation matrix and fixed and random effect parameter estimation. Finally, Section 5 concludes this study and discusses its limitations and recommendation for future works.
2. PREVIOUS LITERATURE
In economic growth literature, the focus was mainly on identifying the most effective factor of production that maintains the sustainability of growth in the long run. Earlier growth models considered the investment saving as a critical enhancement factor of the growth (De Melo and Robinson, 2015; Hochstein, 2017; Li, 2017).
During 1960–1970s, when the neoclassical model was in vague, the technological change was considered as the main determinant of long-term growth as mobility of capital and technology across countries may lead to diminishing return. Thus, there will be a process of growth convergence between developed and developing economies over time.
The new growth theories of Solow (1970), Romer (1986), and Lucas (1988) emphasized on the importance of capital investment derives from increasing returns to capital. Furthermore, knowledge was considered as the most important form of capital, and thus, human capital was regarded as an important factor enhancement of economic growth. The new growth theories also emphasized on the divergence of growth between developed and developing economies over time, as capital accumulation is faster in developed nations and subjected to increasing returns to scale.
The effect of investment, human capital accumulation, trade openness, and inflation was among the most important factors of economic growth that has been studied in the literature. A strand of literature emphasized that trade openness promotes the growth (Kahnamoui, 2013; Marelli and Signorelli, 2011; Wacziarg and Welch, 2008). While some other literature have reached an opposite conclusion (Findlay, 1984; Harrison, 1996; Vernon, 1966). The findings on trade liberalization are still in progress, and research and empirical findings have not yet been conclusive (Peasah and John, 2017).
In an tempt to identify sources of labor productivity in the TFP growth, Bosworth and Collins (2003) in their empirical study used international country-level panel data, and variables such as openness, geographical factors, institutional quality, and policy variables were used as determinant factors of TFP. The result indicated that catch-up effect, openness, geographical factors, and institutional quality have positive contributions to the TFP growth components.
Rioja and Valev (2004) studied the impact of financial development on the economic growth, in doing so, a GMM dynamic panel methodology is applied on a panel data sample consisting of 74 countries, and they found that financial development is one of the main sources of productivity growth in developed countries. While for the less developed ones, the impact of the financial development in the form of capital accumulation will affect the growth. Other recent empirical studies suggested that financial development is a catalyst for economic growth (Ang, 2008; Demetriades and Andrianova, 2004); Levine (2005).
For the East Asian case, the rapid economic growth during the second half of the last century was due to the export-driven growth strategy. As depicted by Kim et al. (2007), the strategy has protected local industries from international competition. Domestic markets were initially protected by imposing trade barriers on international firms to enable the local ones to make enough time to grow up.
The export-driven strategy made governments in these countries to accelerate the catch-up process through redirecting the limited resources to selected promising industries and absorbing technological advances from developed nations. Furthermore, export expansion enhanced the growth in the East Asian countries through promoting productivity growth, by imitating advanced foreign technology, and competing in foreign markets, in addition to the facilitation of factor mobilization and human capital accumulation (Kim et al., 2007).
Perceptions about East Asian growth have changed, as the Japanese economy perished to a long-term depression since the early 1990s, and regional developing countries agonized from the Asian financial crisis of 1997–1998. These turn of economic events have revived the earlier discussions about East Asian economic growth miracle, which had centered around the sources of growth and the role of trade.
In the context of the productivity debate, the capital accumulation advocators argued that rapid growth in East Asia was mainly driven by input factor accumulation, whereas assimilationists believed that the driving force is a high rate of technical change that made possible by the diffusion of technology from the developed countries (Hwang, 1998; Kim et al., 2007; Kim et al., 2009).
The empirical contribution of the current study is that, in the previous empirical studies on economic growth for the Asia-Pacific regions, the focus was on the period from the 1960s to 1990s. The period from the late 1990s onward was rarely covered. This study covers the period of 1994–2011 and tries to examine the factors that play important roles in the rapid growth of Asia-Pacific economies.
In a cross-country setting, an extensive number of theoretical and empirical studies found that the growth is determined by the following factors: Human capital accumulation, income distribution, fertility rate, government expenditure, trade openness, the rule of law, political stability, inflation, and the terms of trade (De Gregorio et al., 2004; Lee and Hong, 2012; Loayza and Fajnzylber, 2005; López-Villavicencio and Mignon, 2011; Qiao, 2007; Yusuf, 2003). All of these studies confirm the so-called conditional convergence of different countries. While many other studies focused on specific economies with specific determinants in the past, this study expands the boundaries of economic enhanced factors to examine and treat a number of determinants that are expected to affect the economic growth. The estimated results of this study are expected to identify the main factors that drive the economic growth in Asia and Pacific economies.
2.1. Data Sources
This empirical study utilizes key indicators for Asia and the Pacific 2012 of the Asian Development Bank annual data sources for the period of 1994–2011, to obtain various macroeconomic variables of selected Asia-Pacific economies. A total of 17 economies were selected such as Australia, Brunei, Cambodia, Hong Kong, India, Indonesia, Japan, Malaysia, Mongolia, Myanmar, Nepal, New Zealand, Philippines, Republic of China, South Korea, Thailand, and Vietnam.
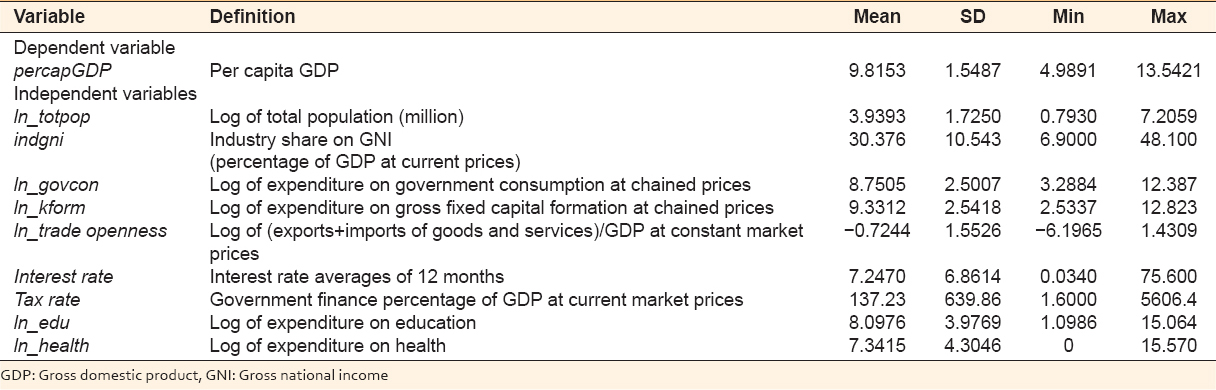
Table 1 presents the definition and explanation of each variable and indicates a number of observation, mean, standard deviation, and minimum and maximum level.
Table 1: Summary statistics of the data (number of observations: 306)
2.2. Model Specification
The current study incorporates the economic variables identified as important factors to growth, drawing heavily on major findings in the study of economic growth. According to the neoclassical model of growth, the growth rate tends to be negatively related to the absolute level of per capita GDP, owing to diminishing returns to capital (Solow, 1970), and several empirical findings support this argument (Barro, 1991).
The implication of these theoretical and empirical results is that, given similar preferences and technologies, poor countries tend to grow faster than rich countries, thus converging toward the same level of income (this is called the convergence hypothesis according to Feng, (2003)). The main reason for this phenomenon from neoclassical growth models is the diminishing returns to reproducible capital. Poor countries tend to have low ratios of capital to labor, and as a consequence, they will get high marginal products of capital. Hence, they tend to grow at relatively high rates.
Earlier studies used single cross-country, assuming identical aggregate production function. However, according to Islam (1995) in the real world, production function may differ across countries, and sometimes, this assumption generates omitted variable bias, as the country-specific aspect of the aggregate production that is ignored in these studies may correlate with the included explanatory variable, thus creating omitting variable bias.
This bias may be corrected for by employing panel data methodology. The advantages of panel data over a cross-sectional study are that the former allows to properly control the heterogeneity of individual countries, both through the estimation procedure and through model specification (Baltagi and Pinnoi, 1995).
The model estimated in this study is formulated as follows:
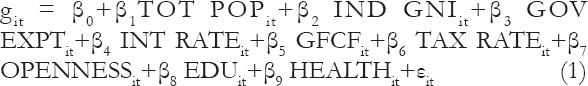
Where εit denotes the error term, and the subscripts i, i = 1,…, N, and t, t = 1,…, T, denote an economy i at the time period t, respectively. git is the growth rate in the real GDP per capita in country i at time t, and βn captures the effect on git of a change in independent variables, holding all the other explanatory variables fixed.
Nine explanatory variables are taken into consideration for the significant effect on the economic growth. The first one is total population, given by TOT POP. IND gross national income (GNI) denotes industry share of GNI, while GOV EXPT stands for government expenditure. Interest rate given by INT RATE is expected to have negative impact on growth. GFCF is the gross fixed capital formation which is expected that the fixed capital accumulation results in higher productivity performance, enhancing GDP growth.
For tax rate, taxation has a negative relationship with growth. OPENNESS is the index of international trade openness, measured by the ratio of exports and imports to GDP. EDU and HEALTH denote spending on education and health, respectively.
The model specification in equation (1) can be modified as follows:
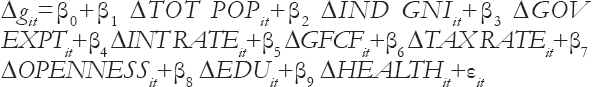
Where Δ is the first-differenced operator. The variables in logarithm form are TOT POP, GOV EXPT, GFCF, OPENNESS, EDU, and HEALTH. The variables of IND GNI, INT RATE, and TAX RATE are not in logarithm form since they are in percentages which imply the change without any modification.
The theoretical expectation is that the results will get negative and significant on the impacts of population, interest rate, and tax rate, while all the other variables are expected to be positive and significant on the growth of per capita GDP. In other words, it is expected that β1, β4, and β6< 0 and β2, β3, β5, β7, β8, and β9 >0.
For the panel estimation technique, this study applied fixed and random effects to estimate equation (2). Hausman test (Hausman and Taylor, 1981) based on the difference between fixed and random effects estimators is also conducted. The test showed that the fixed effect is asymptotically better estimation method.
3. ESTIMATION RESULTS
A correlational analysis is conducted as a preliminary check for the relationships among the variables used in the statistical analysis. Table 2 shows the correlation matrix between independent variables and the dependent variable growth of per capita GDP.
Table 2: Correlation matrix
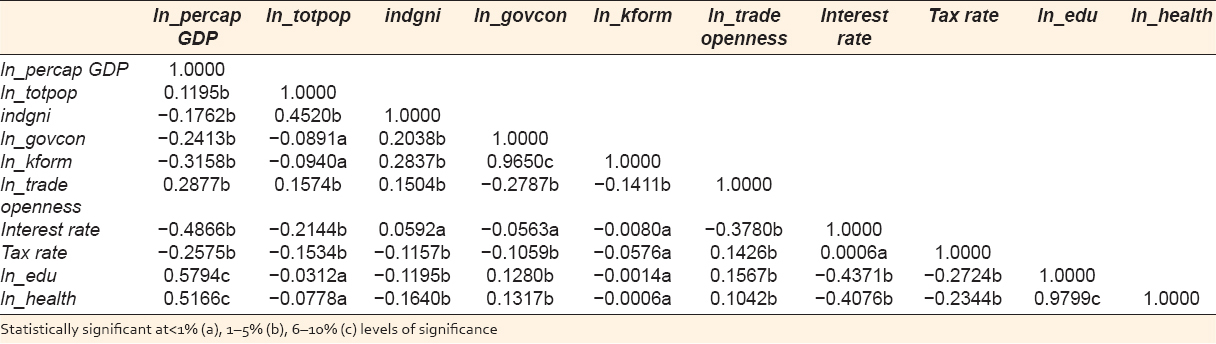
According to Table 2, most of the signs of the correlations are the same as expected. The correlation between total population and per capita GDP is positive and relatively low, while the correlation between industry share of GNI and per capita GDP is negative and low. The correlation between government consumption and per capita GDP is also negative. On the other hand, per capita GDP is negatively correlated with gross fixed capital formation while positively correlated with trade openness.
Furthermore, the correlation between interest rate and per capita GDP is negative and high (its correlation coefficient is equal to −0.4466), and the correlation between tax rate and per capita GDP is also negative. With respect to human capital variables, both the expenditure on education and health are positively correlated with per capita GDP with a high level of correlation coefficient of 0.5794 and 0.5166, respectively.
Table 2 also shows that there are low interactions within the independent variables. All the correlation coefficients are <0.5 except the correlation between government consumption and gross fixed capital formation (which is =0.9650) and the correlation between the expenditure on education and the expenditure on health (0.9799).
Estimates of the fixed effects and random effects parameters are presented in Table 3 where the dependent variable is the growth of per capita GDP. The value of R2 suggests that the independent variables explain about 85% of the variations within the same countries in the dependent variable. From the fixed effect panel estimation results (Table 3), the findings are presented in Table 3.
Table 3: Fixed and random effects parameter estimates
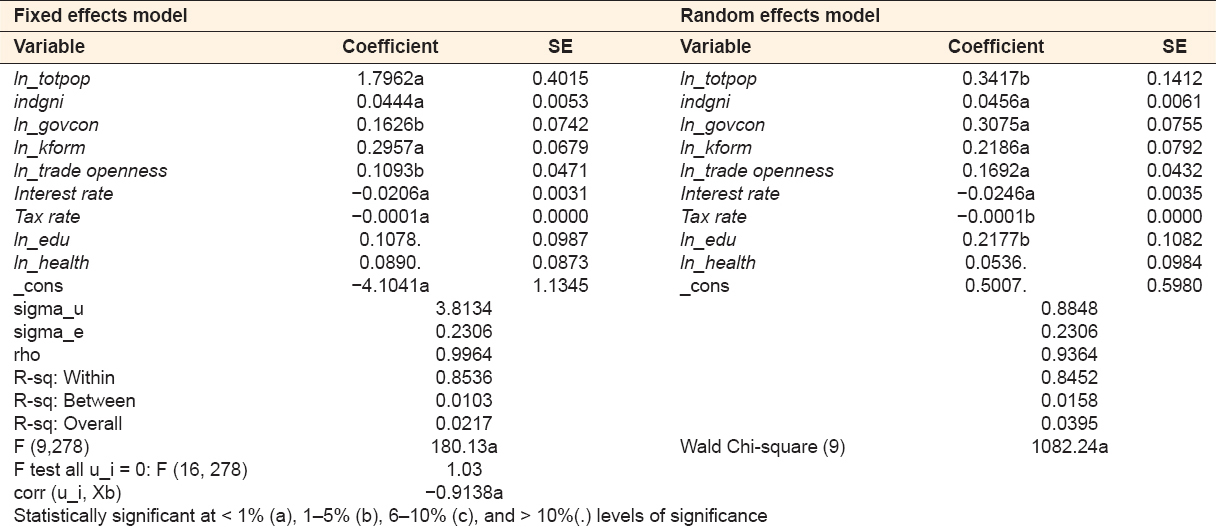
With respect to total population, the sign of the coefficient of ln_totpop is estimated to be positive and consistent with the theoretical prediction. About 56% of the world’s total population is in Asia and the Pacific region (about 3.9 billion people). The most populated countries in the region are China and India that account for about 66% of the region’s total population.
A rapid growth in populations of most Southeast Asian economies was during 1990–2011, particularly in Brunei, Cambodia, Malaysia, and the Philippines, where the average annual population growth exceeded by 2%. Singapore, a highly urbanized economy, posted an average annual growth of 2.7%. From 1990 to 2011, the populations of Brunei D, Cambodia, Malaysia, and Singapore increased by more than 60% (Lee et al., 2012).
An increase in the size of population will result in increase in growth by raising the supply of labor, which derives “scale effect.” The increase in total population may stimulate the economic growth in Asia and Pacific economies by promoting labor force in employment or technology improvement (Lee et al., 2012).
For industry share of GNI, although the coefficient of ln_indgni has a low level of significance, it is positive and consistent with the theoretical prediction. This supports the theoretical expectation that industrialization process is enhancing social efficiency, which may have positive effects on economic growth in the long run.
For government expenditure, the coefficient on ln_govexp is significant and with the expected sign. On the other hand, the Asia-Pacific economies take gross fixed capital formation as an essential substance of economic growth. This argument is supported by the coefficient of ln_kform reported in Table 3, turning out to be positive and statistically significant which is noticeably consistent with the study of Chongvilaivan (2012).
The statistical result of ln_trade openness indicates that the effect of trade openness, exports and imports of goods, and services on economic growth is significant. As trade openness increases a market size appropriated by successful innovators or increases the production scale, thus there is an increase in the effects of learning-by-doing externalities on economic growth, this is due to the fact that trade openness lead to increase in the production scale and increases the market size appropriated by successful innovation
The impact of market size is more valid for smaller economies that try to enlarge the market by a higher proportion when opening up to trade. Trade liberalization will have an additional effect on economic growth; it tends to stimulate product market competition which will result in enhancing domestic productivity. This is because it forces the most unproductive firms exit from the local market and it forces local firms to gain innovation capabilities to overcome competition with their new foreign counterparts (Aghion and Durlauf, 2009).
The sign of interest rate is consistently negative supporting the theoretical prediction arguing that low-interest rates can help the economy to recover and achieve positive growth. The negative sign of the tax rate coefficient indicates the inverse relationship between the tax rate and economic growth, the higher the tax rate imposed by the government, and the lower the economic growth the country will have.
For the expenditure on education and health, both of the coefficients of ln_edu and ln_health are consistently positive supporting the theoretical expectation that human capital has positive effect on growth.
4. CONCLUSION
The economic well-being of the East Asia countries attracted a wide range of scholars to conduct empirical studies investigating the determinant of the growth. This study widens the boundaries of economies to examine and treat a number of determinants that are expected to affect the economic growth.
Through this study, key determinants of per capita GDP growth are investigated in a panel data consisting of 17 Asia-Pacific economies; Australia, Brunei, Cambodia, Hong Kong, India, Indonesia, Japan, Malaysia, Mongolia, Myanmar, Nepal, New Zealand, Philippines, Republic of China, South Korea, Thailand, and Vietnam for the period of 1994–2011. Panel regressions analysis reveals that the factors mentioned above along with the industry share of GNI, government consumption, gross fixed capital formation, trade openness, interest rate, tax rate, and expenditure on the education and health are significant determinants of growth.
The main findings from the study were obtained from the analysis of correlation and regression. From the correlation analysis, the signs of correlation coefficient were positive in independent variables of total population, trade openness, expenditure on education, and health when per capita GDP is the dependent variable. On the other hand, the signs of correlation coefficients were negative in independent variables of industry share of GNI, government expenditure, gross fixed capital formation, interest rate, and tax rate.
From the analysis of regression, all the variables were in line with theoretical expectation. Total population, industry share of GNI, government consumption, gross fixed capital formation, trade openness, and expenditure on education and health are consistently significant, and the signs of regression coefficients are positive. On the other hand, interest rate and tax rate are also consistently significant and negatively related to the growth of per capita GDP.
Since this study used per capita GDP as the dependent variable of economic growth, further studies may extend the range of output to TFP to supplement the limitation of this study. Although human capital is expected to be the main driver of economic growth, the result from the correlation analysis presented that there is a high correlation between expenditure on education and health. To show the impact of human capital on economic growth in Asia-Pacific regions, estimation with years of schooling may enhance the study instead of using expenditure on education and health.