1. INTRODUCTION
Following the classic paper by Solow (1956), there has been a significant development in the theoretical and empirical literature of endogenous growth. Much attention is paid to the issues of the failure of countries to converge in per capita income. A large number of studies use data from the Penn World Tables (Summers and Heston, 1991). Solow studied economic growth by assuming a neoclassical production function with decreasing returns to capital and the rates of saving and population growth are considered as exogenous determining the steady-state level of income per capita across countries. The countries reach different steady states due to variations in these key determinant factors. The higher the rate of saving and the lower the population growth the richer the country and the lower the rate of return to physical and educational capital. More than half of the cross-country variations in income per capita can be explained by those two variables. A large body of literature found Solow’s prediction of the direction of the effects to be consistent with the empirical evidence, but not the magnitudes.
The issue of convergence has developed in three different directions in the growth literature. The first type, beta-convergence, considers the speed at which income per capita tends to a steady-state value of income from some initial level. Depending on the type of data used, the estimate of the speed of convergence is based on the coefficients of lagged income or some initial conditions. Convergence can be conditional or unconditional on some country-specific variables and to a common or country-specific steady-state assuming a homogenous or heterogeneous growth rate (Lee et al., 1997). The third type, sigma-convergence, considers the behavior of cross-country variance of income over time. It assumes that global technology and tastes determine convergence to a common steady-state of income at the same rate across countries (Quah, 1993). In the sigma type, the income per capita is treated as an integrated variable. The objective is to determine whether sample countries share a common deterministic and/or stochastic trend (Durlauf, 1996 and Evans, 1996). In this paper, we consider conditional convergence.
The Solow model was augmented by Mankiw et al. (1992) to include the accumulation of human capital.1 According to this model, the convergence path is a linear time trend, the slope of which is determined by the rate of exogenous technical progress, while the intercept reflects the effects of factors characterizing the conditional convergence. The inclusion of human capital was motivated because the accumulation of human capital may be correlated with saving and population growth rates resulting in biased estimated effects. Thus, the exclusion of human capital can explain the overestimation of the effects of saving and population growth on the level of income. The explanatory power of the human capital augmented model increased to about 80% of the variation in income which provides a satisfactory explanation to the differences in the wealth among the sample of nations. Empirical results show evidence that countries converge given differences in their saving and population growth rates are taken into account. Furthermore, the model explains the magnitude of over-estimation of the influences of saving and population growth.
The objective of this study is to examine conditional convergence of Organisation for Economic Co-operation and Development (OECD) countries in the gross domestic product (GDP) and health care expenditure (HCE) per capita. The main emphasis is on estimating the effects of health on economic growth. It presents an estimation of the investment in physical, educational, and health capital augmented growth model to explain variation in output and HCE expenditure per capita across countries. Although the Solow model has been augmented in different ways,2 there are few studies that examine the effects of health capital on growth. In Knowles and Owen (1997), the labor variable in an aggregate production function is education and health augmented. Their result suggests that incorporating educational and health capital as labor augmenting or as separate factors of production do not change the conclusions empirically. Again results suggest a strong and positive relationship between income and health. Unlike in the MRW model, the effect of educational capital is insignificant. Temple (1999) also found the effects of educational capital to be data specific and sensitive to the model specification and estimation methods used. Bhargava et al. (2001) investigate the effects of health indicators measured as adult survival rates (ASR) on GDP growth rates. The results showed positive effects of ASR on GDP growth rates in low-income countries. McDonald and Roberts (2002) show that omitting health capital from augmented Solow growth models produces misspecification biases. They find health capital to have a significant impact on economic growth rates.
This paper is an extension of the previous literature in a number of ways. First, it augments the Solow model to health capital. Health capital is proxied by HCE per capita.3 Second, the analysis is further related to the studies of HCE where GDP per capita appears to be the main factor determining the level of expenditure on health care (Bac and Pen, 2002). The issue of causality relationship between GDP and HCE is investigated. Third, in the later model regression of the speed of convergence on variables determining the speed of convergence show any link to the variables characterizing the health-care system of sample countries. Fourth, we investigate how sensitive the speed of convergence is to the literature frequently imposed restriction of constant depreciation and technological growth components. Finally, the empirical analysis is based on a study of a homogenous group of countries’ (OECD) data for an extended period of 1970–1992.
The findings in this paper are in line with those of Mankiw et al. (1992) and support the assumptions of decreasing return to capital, the improved prediction performance of the model and countries convergence to different steady states. Cross-country results indicate that OECD countries converge at the rate of 2.7% per year to their steady state of income per capita with the usual Solow model. HCE has a significant effect on the economic growth and the speed of convergence. When investment in health is explicitly taken into account in the model, the speed of convergence is increased to 3.7%. The speed of convergence is also found to be sensitive to various specifications of capital depreciation and technological growth components. In the absence of any assumptions about the sizes of those two components, the rate of convergence increases to 5.2%. Considering the rate of convergence in the HCE model, the results show that OECD countries converge at 2.5% to their steady state of HCE per capita.
In Section 2, the growth model is outlined. The model is augmented to include investment in physical, educational, and health capital. The issues of variations in output per capita across countries, endogenous growth, and convergence are discussed. The analysis is further extended to the health-care literature by analyzing the issues of causality between GDP and HCE. Section 3 presents the data from OECD countries. Section 4 discusses the issues of estimation and presents empirical results under the various specifications suggested in Section 2 and discusses their implications for the speed of convergence in income per capita or HCE. Section 5 summarizes the results and concludes.
2. THE HEALTH CAPITAL AUGMENTED MODEL
2.1. The Augmented Growth Model
In the Solow’s (1956) growth model, the rates of saving, population growth, and technical change are exogenous. Assuming a Cobb-Douglas functional form and two-factor inputs of capital and labor, the labor-augmenting technological progress at time t is written as:

where Y is output, K capital, L labor, and A the level of technology. The subscripts i and t denote country and time periods, respectively. To simplify the notation, we drop the subscript i. Labor and technology are assumed to grow exogenously at rates of n and g as

that makes the effective units of labor (AtLt) to grow at the rate n+g. Defining kt=(Kt/AtLt) and Yt=(AtLt) as the stock of capital and the level of output per effective unit of labor, the evolution of capital is governed by

where a dot indicates change, is a fraction of output invested in physical capital in period t, and δ is the rate of depreciation. The stock of capital (kt) converges to a steady-state value of capital defined as

which is positively related to the rate of saving but negatively to the growth rate of population.
The Solow model concerns the impact of saving and population growth on real income. Substitution of equation (4) into (1) and taking logs, the steady-state income per capita is written as

where β0=(lnA0+gt) denotes the technology factor and ε is stochastic country-specific shock. The model in equation (5) has frequently been used as the basic model in empirical specifications (e.g., Summers and Heston (1988), Barro and Sala-i-Martin (1992), Islam (1995), among others). The rate of saving and population growth is assumed to be independent of ε and the model is estimated with OLS.4
Assuming that the countries are currently in their steady states, Mankiw et al. (1992) used (5) to see how saving, and population growth rates explain the difference in the current per capita income across countries. The coefficient of capital (α) was found to be high requiring a definition of capital in a broad sense that incorporates educational capital. Thus, educational capital was included as another input of production (Barro and Lee, 1993; Benhabib and Spiegel, 1994). Augmentation of educational capital to the process of growth showed to be useful concerning the performance of the model and the size of α. Ignoring educational capital affects the coefficient on physical capital investment and population growth leading to incorrect conclusions. The production function in equation (1) is rewritten as

where H is the stock of educational capital and in addition to growth in physical capital (3), the stocks of educational capital growth is determined by

where is a fraction of output invested in educational capital in period t and ht=(Ht/AtLt) is educational capital per effective unit of labor. The relation in (7) indicates that the stocks of physical and educational capital grow only if new investment exceeds depreciation adjusted for population growth and technological progress. The steady-state income per capita as a function of population growth and accumulation of physical and educational capital is given as
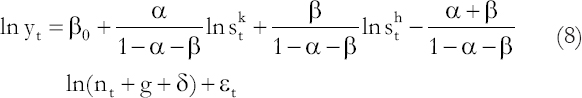
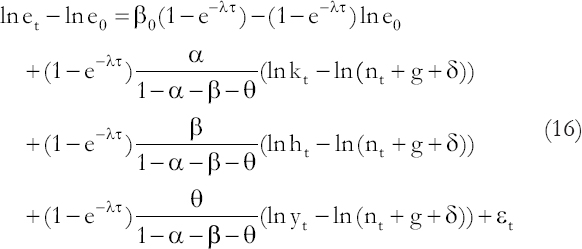
Similar to the educational capital augmentation, the Solow model can be augmented to investment in health as well. The evolution of the HCE is determined by

where is the share of output invested in health capital in period t and et=(Et/AtLt) is an effective investment in health per capita. The model in equation (8) is then rewritten as
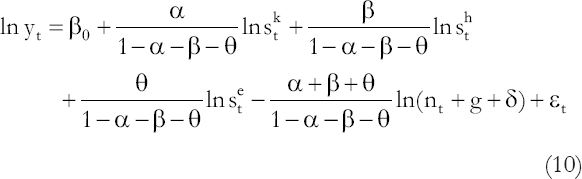
where the model can be estimated with OLS. The model in equation (10) indicates that the steady-state path for the log of income per capita follows a linear time trend. The slope of this linear trend is exogenously determined by the rate of technical progress, while the intercept reflects the effects of the rate of population growth and investments in physical, educational, and health capital. Adding educational and health capital improve the performance of the Solow model. Investment in educational, physical, and health capital is expected to increase the level of income per capita, while high population growth lowers income per capita. Educational and health capital accumulations increase also the impact of physical capital accumulation on income. Educational capital and healthiness are positively correlated with saving rate and negatively correlated with population growth.
2.2. The Endogenous Growth and Convergence
The endogenous growth models are characterized by the assumption of non-decreasing returns to the set of production factors implying countries with a higher saving rate to grow faster. Hence, countries do not need to converge to a common level of income per capita even if they employ the same technology. The model predicts that countries reach different steady states. It does not predict convergence between countries, but only convergence within country or convergence to own steady-state value of per capita income. The convergence is thus conditional on the determinants of the steady state, accumulation of various components of capital and population growth. Predictions about the speed of convergence are given by

where and ln yt are the log of steady-state level and actual values of per capita income in period t given by equation (10) and λ is the annual rate of convergence at which the economy moves to own steady state

Although the rate of population growth differs across countries and over time, in previous studies λ is assumed to be constant across countries at a value interpreted as the average speed of convergence. Equation (11) implies that

where ln y0 is log of income per capita at some initial year. According to the model above, countries are different both in their levels of income per capita and their growth rates in income. The latter differences result from differences in the initial level of income per capita and the steady-state value. Countries with a higher level of initial income will experience slower growth. For the given initial level of income countries with higher rates of investment in physical, educational, and health capital or lower population growth will experience faster growth. Subtracting ln y0 from both sides and substituting for the model
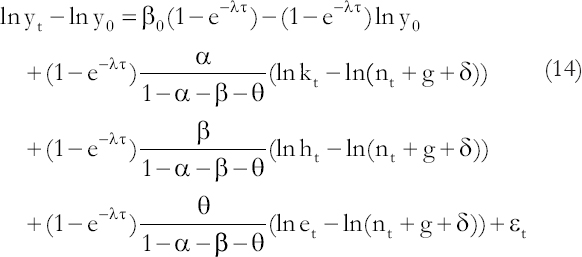
is the health capital augmented Solow model in which the growth in income is a function of the determinants of steady state and the initial level of income. Thus, in the endogenous growth model outlined above, there is no common steady-state level of income, and the difference in income per capita among countries can persist indefinitely for the same savings and population growth rates.
Solow’s model predicts both the sign and the magnitude of production factors of saving and population growth on the standards of living. Real income is predicted to be higher in countries with higher saving rates and lower in countries with higher values of (nt+g+δ). Since the capital share in income (α) is about 1/3, the elasticity of income per capita with respect to the saving rate () is about 0.5, and the elasticity with respect to ln(nt+g+δ) about –0.5. In empirical studies, the sum of g (0.02) and δ (0.03) is assumed to be constant and equal to 0.05. MRW found that reasonable changes in this assumption have little effect on the estimates using US data. The model in equation (14) can then be estimated both with and without the constraint that the coefficients of and ln(nt+g+δ) are equal in magnitude but opposite in sign, and tested. Alternatively, one can estimate μ from the following relation
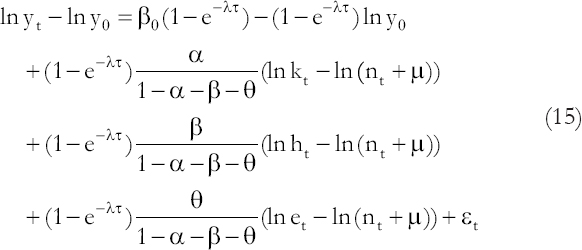
and compare the estimate of μ with the imposed constraint (g+δ=0.05).
The analysis is further related to the studies of HCE where GDP per capita appears to be the main factor determining the level of expenditure on health care
or alternatively, one can estimate μ from the following relation
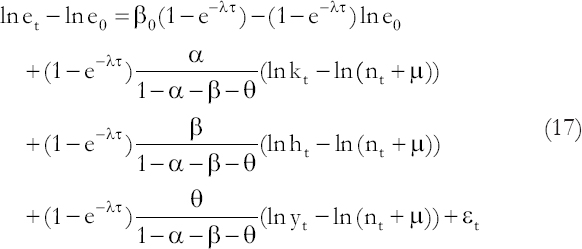
and test it against the imposed constraint. The slope is exogenously determined by the rate of technical progress, while the intercept reflects the effects of the rate of population growth and investments in physical and educational capital and GDP growth. Investment in educational and physical capital and GDP growth are expected to increase the level of HCE per capita, while high population growth lowers investment in health.
The issues of causality relationship between GDP and HCE are examined by regressing the log of GDP (ln y) and HCE (ln e) on their past values and testing for their joint significance as follows
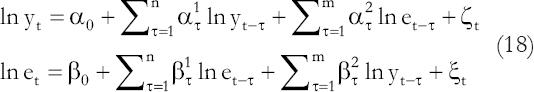
where non-zero values of and are indications of causality relationships between the two variables.
Using the parameter estimates from equation (13) to (17) estimates of the rate of convergence are obtained. The rate of convergence varies across sample countries as a result of growth in population. The sensitivity of the speed of convergence is examined with respect to the assumption of constant depreciation and technological progress. A regression of the speed of convergence on variables determining the rate of convergence is performed

where xj is a vector of variables characterizing the health-care system of the sample countries.
3. THE DATA
The data are obtained from the Penn World Data (PWD) known as Summers and Heston (1991) data. The current data set is an updated version of the previous versions called Mark 5.0 and Mark 5.6. PWD allows access to online statistics covering 29 key variables on 151 major world economies for which data are available. The data are annual and cover the period of 1950–1992. The information includes population, various definitions of GDP, private and public consumption, investment, different components of capital, exchange rate, standard living index, and measures of openness.
The PWD data were further completed with information on educational capital obtained from the Barro and Lee (2000) and HCE extracted from the OECD Health Data File. The Barro and Lee data contain information on educational attainment at various levels for male and female populations. The sample includes 129 countries observed quinquennially during 1960–1990. 115 of the sample countries are found in the sample countries of the Summers and Heston (1991).
Although the sample in this paper is restricted to OECD countries, our results can be compared to those of previous studies. Other factors determining the sample size are the availability of information on educational capital, HCE, and GDP per capita. The final sample used in this paper is similar to Summers and Heston (1988), Mankiw et al. (1992), and Islam (1995) subsample of OECD countries5 but updated to 1992.
The variables used are GDP (y), HCE (e), population growth (n), investment in physical (k), and educational (h) capital. The GDP is defined as real GDP per worker (RGDPW) in 1985 international prices. The investment in physical capital is measured as the percentage real investment share of the GDP in 1985 international prices. Population growth is defined as the year to year growth rate of the population that includes all ages. Educational capital is defined as average schooling years in the total population above the age of 25. Following a number of studies, the rate technological progress and depreciation (g+δ) is taken to be constant across countries and over time. It is assumed to be equal to 0.05 in the constrained growth models, while it is estimated as a constant parameter in the unconstrained models.
Considering the period of 1970–1992, we have five data points for all of the sample countries. The growth rate in GDP, population growth, investment, and educational capital are with the exception of the last period measured as 5 years averages: 1970–1974, 1975–1979, 1980–1984, 1985–1989, and 1990–1992. HCE is measured in per capita terms at constant 1990 international prices.6 For the transformation of HCE the national GDP price index and purchasing power parities for the base year, 1990 as deflators are used.
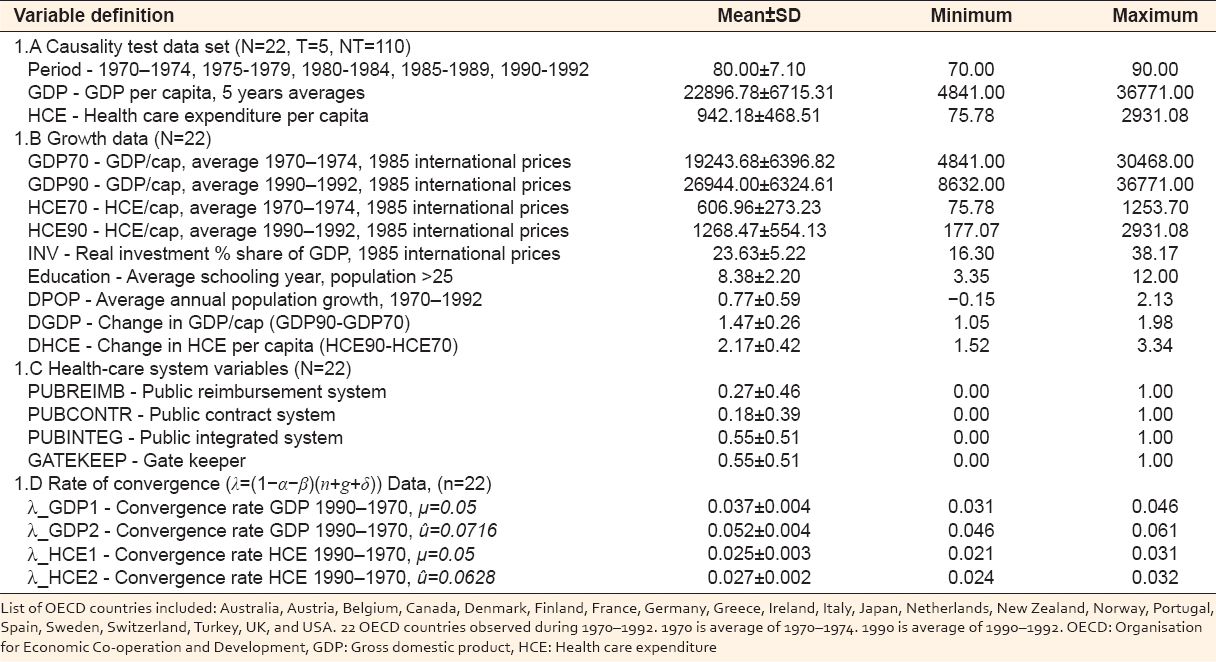
A number of system variables are considered as determinants of the speed of convergence. These variables represented the sample countries’ health-care system in 1991. Public reimbursement (PUBLREIMB), public contract (PUBLCONT), public integrated (PUBLINTEG), and gatekeeper (GATEKEEP) are defined as one indicating whether a country has any of the above systems as dominant means of remunerations in the in-patient care, 0 otherwise. The data are a balanced panel data where countries are observed consecutively. A summary statistics of the data is found in Table 1.
Table 1:Summary statistics of the OECD data, 1970–1992
4. EMPIRICAL RESULTS
4.1. Specification Tests and Parameter Estimates
The GDP model equation (10) with various degrees of augmentation (educational and health capital) was estimated using cross-country data. First, the model was estimated separately using 5 years average cross-sectional 1970 and 1990 data. This approach has the disadvantages of not providing any information about the dynamic process of convergence. Second, the model was estimated using 1970 as initial income to capture the dynamics of convergence.7 Third, the models were estimated both with and without imposing the constraint that the coefficients on investment and population growth are equal in magnitude but opposite signs. Fourth, later models are estimated assuming that the sum (g+δ) is equal to the constant 0.05 (equation 14) or alternatively estimate the sum from the data (equation 15). Fifth, the procedure is applied to the HCE class of models (equations 16 and 17) again with various degrees of augmentation (educational capital and GDP per capita) and restrictions imposed. Sixth, the issue of causality between GDP and HCE is examined (equation 18). Finally, the rate of convergence is regressed on the health-care system variables (equation 19).
The models are estimated using both linear and iterative non-linear regression methods. To conserve space, only estimation results from the general versions of the models are reported here.
4.2. The GDP per Capita Models
The results for the GDP models are presented in Table 2. Mankiw et al. (1992) found that including educational capital accumulation to the Solow model can potentially alter either the theoretical or empirical analysis of economic growth. At the theoretical level, the changes are related to the nature of the growth process which at the empirical level, educational capital can be considered as an omitted variable. Leaving out educational capital affects the coefficients on investment and population growth. Analogously a disaggregation of capital into physical, educational, and health capital investments has both theoretical and empirical implications.
Table 2:Augmented static and dynamic GDP per capita models
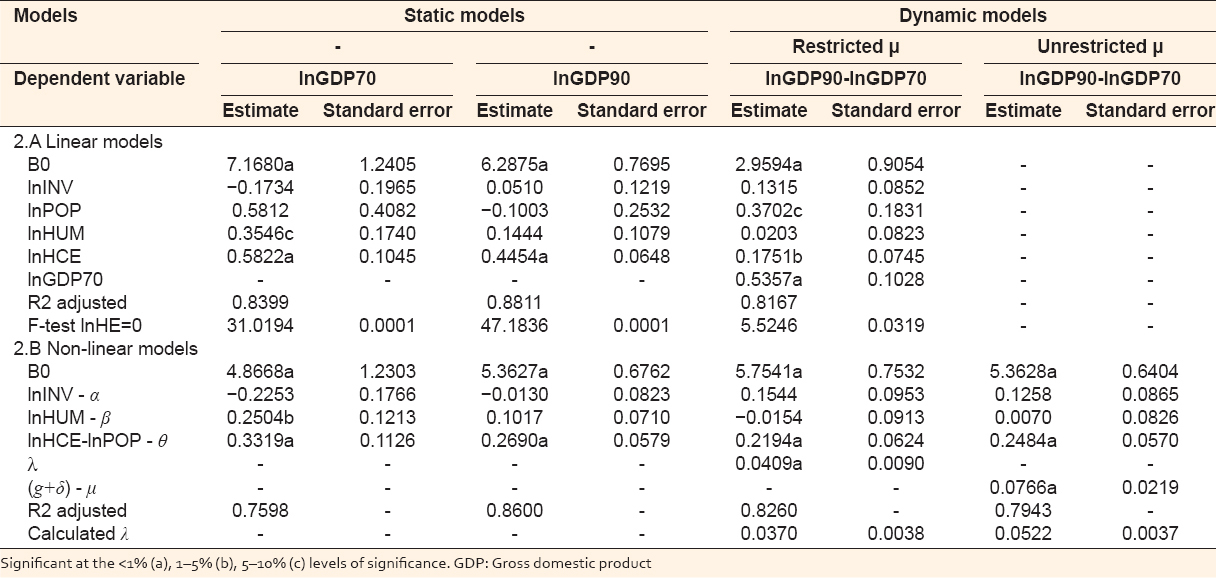
The coefficient of the initial value of GDP is negative indicating a positive relationship between growth and the initial distance from the steady state. The coefficient of investment in capital is positive showing that growth is an increasing function of saving. The coefficient of educational capital is unexpectedly negative and insignificant. Educational capital can be accumulated through improvements in health (Mushkin, 1962) and capacity of work suggesting that improved nutrition and health status affect labor productivity positively (e.g., Strauss and Thomas, 1995). Moreover, the results are also sensitive to the influence of some sample countries. The insignificance effects of the educational capital held even when the data were split into developed and less developed country subsamples.
Investment in health care is found to have positive effects on growth, while population growth has negative effects. These results are consistent with results found in previous studies. It should be noted that the proxy for investment in health capital in our study is the proportion of income spent on health, while Knowles and Owen used life expectancy to proxy health capital. Their choice of proxy was due to the fact that health spending can be associated with different actual outcomes across countries. The OECD countries are relatively homogenous group of countries. Hence, HCE per capita is an appropriate proxy for investment in health.
4.3. The HCE per Capita Models
The results of the HCE models are presented in Table 3. A simple specification similar to the one appearing in the health literature shows that GDP per capital is a major determinant of the investment in health (for a recent survey see, Gerdtham and Jönsson, 1998). The coefficient of GDP is found to be positive and significant. GDP alone explains >85% of the total variations in the HCE per capita in 1970. The corresponding explanatory power is 89% in 1990. The coefficient is larger than one indicating that a larger fraction of GDP growth is invested in health care. There is a decline in the size of the coefficient of lnGDP when one uses the change in lnHCE between 1970 and 1990.
Table 3:Augmented static and dynamic HCE per capita models
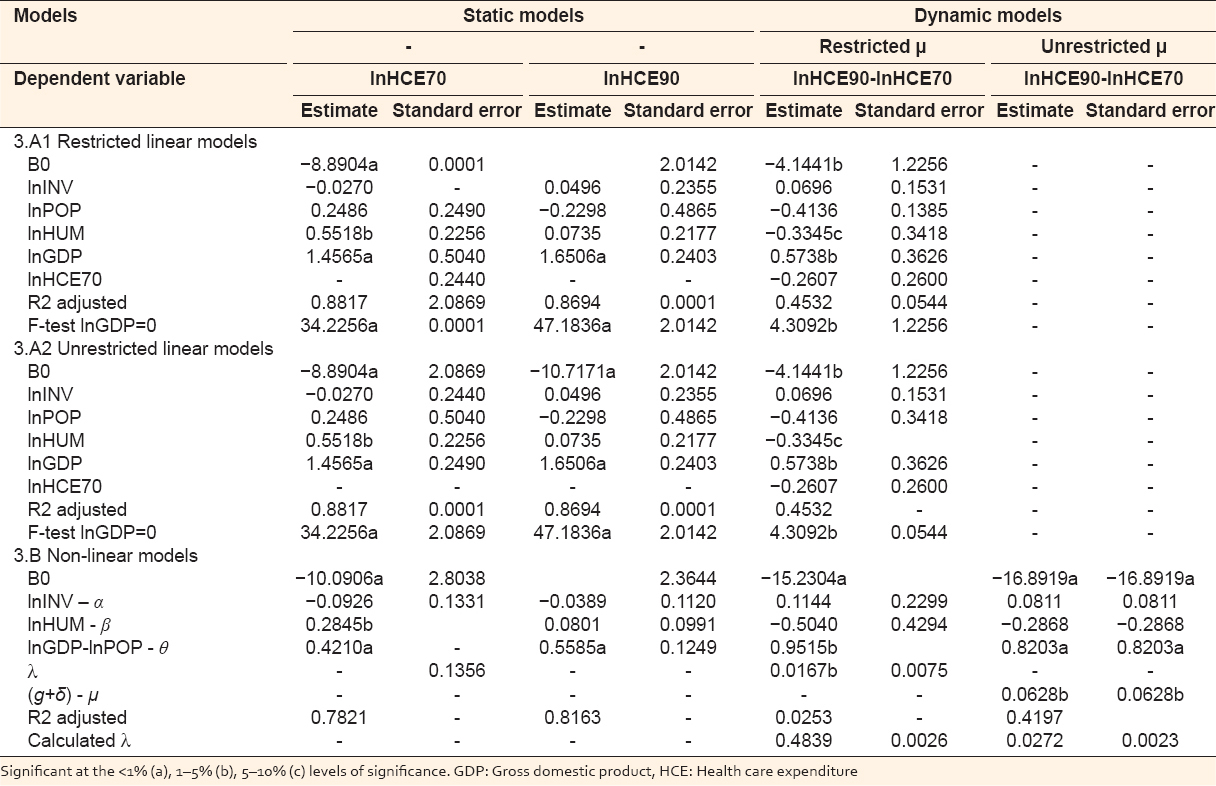
The coefficient of the initial level of HCE is negative indicating a positive relationship between growth and the initial distance to the steady-state level of HCE. The effect of population growth on HCE is negative. The effect of investment in educational capital on HCE is unexpectedly negative and in most model specifications statistically insignificant. Unlike the GDP model, an augmentation of the HCE model to incorporate investment in physical and educational capital and population growth does not alter the sign and significance of the GDP coefficient. However, the model performance is not improved, and most of the extra parameters are found to be insignificant.
4.4. The Speed of Convergence
The estimated rate of convergence form the GDP and HCE models is presented in Table 1 and at the bottom panels of Tables 2 and 3, respectively. The GDP model predicts convergence to the steady-state level of income per capita at an annual rate of 3.7%. The corresponding rate where the technical change and depreciation rates are estimated is 5.2%. Restrictions imposed on the size of (μ=g+δ) results in the underestimation of the speed of convergence. The parameter estimates are constant, but the growth rate of population is country specific. Hence, the rate of convergence becomes country specific. Depending on the specification of μ, the percentage convergence rate varies in the intervals 3.1–4.6% and 4.6–6.1%, respectively. A summary statistics of the rate of convergence is given in Table 1.
The HCE model predicts a lower rate of convergence to the steady-state level of HCE. The rate is 2.5% and 2.7% depending on whether one imposes any restriction of the size of (g+δ) or not. Again the sum of (g+δ) is found to be statistically different from the 0.05. The lower convergence rate in investment in health compared to income per capita can be explained by the difference in the countries’ preferences in public spending. The range of variations in the convergence rate in HCE models is much smaller, 2.1–3.1% and 2.4–3.2%, respectively.
It should be noted that results from cross-sectional analysis of growth and convergence should be treated with caution. A number of recent studies (Solow (1994), Lee et al. (1997), Knowles and Owen (1997), among others) show potential sources of bias in cross-sectional, pooled and heterogeneous panel estimation of convergence coefficient. The magnitude of bias can be larger in the GDP model due to the simultaneity of health and educational capital inputs. Their significance might reflect the ability of countries with faster growth in devoting more resources to investment in health care and education.
4.5. Causality Relationship between GDP and HCE
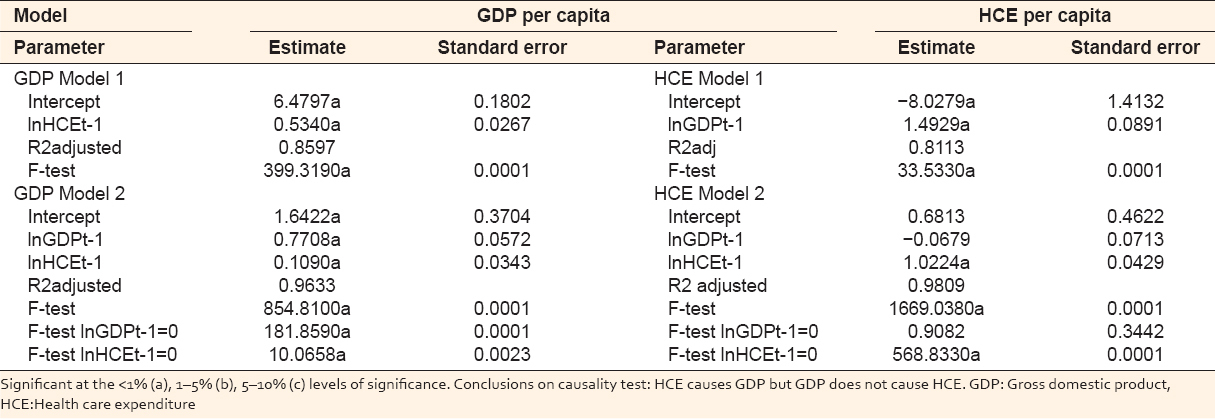
The augmentation of HCE in the growth model and the specification of HCE in the health literature as a function of GDP imply the issue of causality to be important in this respect. Granger’s concept of causality is that a variable x causes a variable y if taking account of past values of x leads to improved predictions for y, all other things being equal. The most common approach to answer the question of the relationship between x and y is to regress x on y and test the coefficient of y for significance. In the current case, it is important to establish and test the direction of causality. Using the relation in equation (18) for the test of causality between GDP and HCE the values of m and n were set to 1, respectively. The choice of the minimum lag structure was due to a few periods of observations.
The test results presented in Table 4 indicate the presence of unidirectional causality from HCE to GDP. Contrary to the case in the health care literature this is interpreted as a rejection of the hypothesis that causality is unidirectional from GDP to HCE. Hence, the GDP and HCE models can be estimated as single equations. Although the sample countries are very homogeneous, the data set is very small, the time series dimension of the data (T = 5) is short, and the results should be interpreted with caution.
Table 4:Test for causality between GDP and health care expenditure per capita
4.6. Determinants of the Rate of Convergence
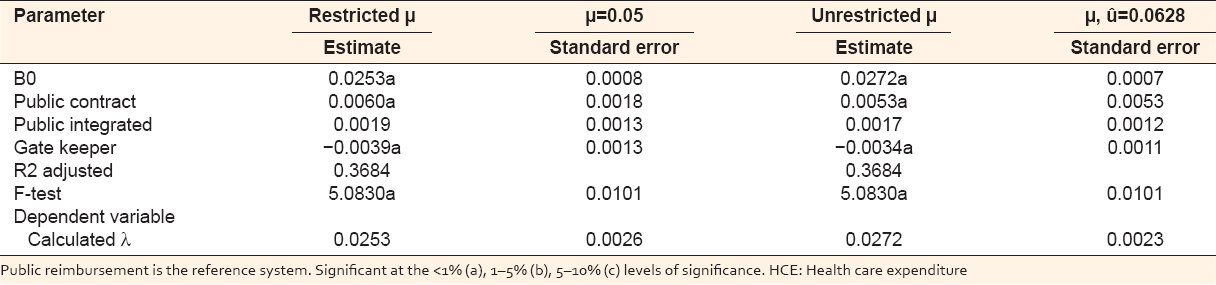
The results from a regression of the rate of convergence obtained from the HCE model on a number of health-care system variables that are considered as determinants of the speed of convergence are reported in Table 5. These variables represented the sample countries’ health-care system in 1991. PUBLCONT has a positive effect on the rate of convergence while GATEKEEP system has a negative effect compared to the reference group of PUBLREIMB. The coefficient of PUBLINTEG is found to be insignificant. Austria, Canada, Germany, and Netherlands have mixed PUBLCONT and GATEKEEP systems with both positive and negative effects on the rate of convergence. Most of the sample countries including Denmark, Finland, Greece, Ireland, Italy, New Zealand, Norway, Portugal, Spain, Sweden, Turkey, and UK have a PUBLINTEG system with no effects on the convergence rate. The reference group with PUBLREIMB health-care system includes Australia, Belgium, France, Japan, Switzerland, and USA. The two models which differ by the size of μ give identical results.
Table 5:Determinants of rate of convergence obtained using HCE per capita (lnHCE90-lnHCE70) models
5. SUMMARY AND CONCLUSIONS
This paper examines conditional convergence of OECD countries in GDP and HCE per capita for the period 1970–1992. It presents an estimation of the augmented Solow model to explain variation in output per capita across countries. The variation is due to different steady-state growth paths resulting from differences in the countries savings rate, education, and population growth.
This paper is an extension of the MRW paper to HCE. The analysis is further related to the studies of HCE where GDP per capita appears to be the main factor determining the level of expenditure on health care. The causality tests show a unidirectional causality from HCE to GDP but not from GDP to HCE. The result indicates that OECD countries converge at 3.7% per year to their steady state of incomes per capita. HCE has positive effects on the economic growth and the speed of convergence. An inclusion of HCE in the growth model results in an insignificant coefficient of educational capital.
The speed of convergence is also found to be sensitive to whether one imposes a constant or estimates the depreciation and technological growth components. With no restrictions imposed the convergence rate is 5.2%. Considering the rate of convergence in the HCE model the results show that OECD countries converge at 2.5–2.7% to their steady-state level of HCE per capita. Again the assumption of constant rate of depreciation and technological growth underestimates the rate of convergence.
In the latter models, a regression of the speed of convergence on variables determining the rate of convergence shows a close link to the variables characterizing the health-care system of sample countries. PUBLCONT has a positive effect on the rate of convergence while GATEKEEP system has a negative effect compared to the reference group of PUBLREIMB. The system of PUBLINTEG is found not to be significantly different from the PUBLREIMB.